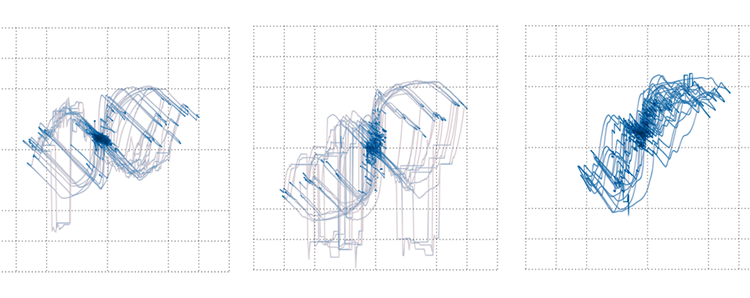
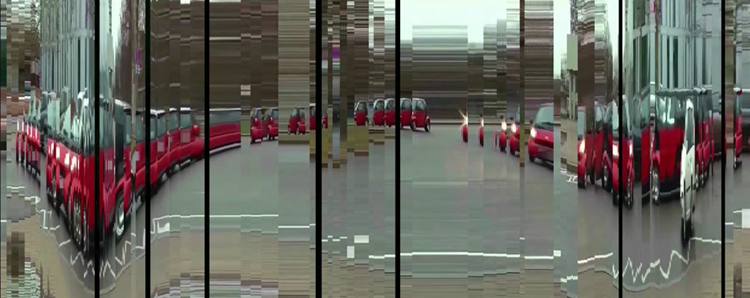
In cooperation with the Robert Bosch Krankenhaus (RBK) in Stuttgart (Germany), we have analyzed eye-head coordination while walking in healthy participants and patients with neurodegenerative diseases. Proper coordination is essential for body balance and thus health. Injuries and other consequences from keeling over can impair quality of life massively. Often, old people never get on their feet again when breaking a leg or hip.
Impression from EuroVis 2017
This year’s EuroVis, one of the most important visualization conferences in Europe, as well as many co-located events took place in Barcelona, Spain. Despite outside temperatures of well beyond 30°C, the attendees enjoyed many interesting talks on the latest visualization research topics and discussed them with researchers in the field from all over the world.
Report from IEEE PacificVis 2017
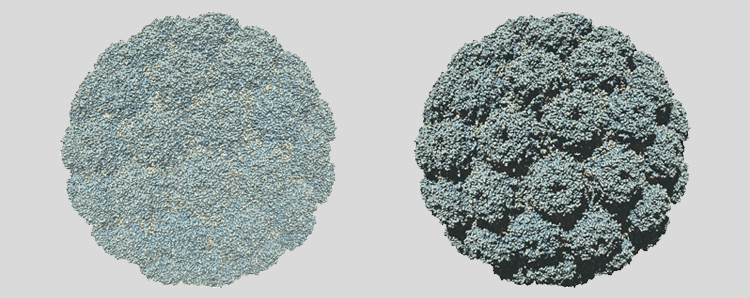
In the second half of April, I had the pleasure to attend the 10th IEEE Pacific Visualization Symposium, usually called “PacificVis”, that was hosted this year by the Seoul National University in South Korea. I gave a talk at PacificVis about our Notes paper “Implicit Sphere Shadow Maps”. It presents a way to render high-quality soft shadows for particle data sets in real time.
Abstract Data Visualization: A Qualitative Study with Intelligence Data Analysts
Visualizations represent a means to communicate data and analysis results. Our research at the Chair for Data Analysis and Visualization is driven by real-world problems and intends to bring the human capabilities and perception together with computer algorithms, using visualization. Thereby, we face the key challenge of how to visually communicate data to the human. A common assumption of visualization researchers is: the more abstract a representation is, the harder it is to interpret for the human, in particular if not trained in reading visualizations.
On the Impact of the Medium in Visualizations for Software Comprehension
During this winter, I spent the last three months at the Data Analysis and Visualization Group led by Prof. Dr. Daniel Keim at the University of Konstanz. During this stay I had the opportunity to meet many researchers who work in visualization and visual analytics in multiple domains and pursue my research work.
At SIGGRAPH Asia 2016 in Macao
For SIGGRAPH Asia 2016 more than six thousand people from all over the world came to Macao. For four days, the attendees of the largest annual conference in computer graphics and interactive techniques in Asia, exchanged their latest and current results in research, projects and developments in various related areas.
Further Contribution to IEEE VIS 2016
Our last post was about presentations at IEEE VIS 2016 in Baltimore. Apart from the already mentioned publications, there were more presentations by SFB-TRR 161 scientists at the conference.
IEEE VIS 2016 in Baltimore
This year, the IEEE VIS conference took part in Baltimore, Maryland which is also dubbed ‘Charm City’ by the locals. The conference was held in the Baltimore Convention Center, at the Hilton Hotel. The location is situated not far from the Inner Harbor of Baltimore, a very nice and scenic place. The conference consists of three tracks (InfoVis, SciVis & VAST). Additionally, there are many workshops and tutorials.
Conference Report from VMV 2016
This year’s 21st Symposium on Vision, Modelling and Visualization (VMV) was hosted by the University of Bayreuth. International scientists presented their newest research in various sessions related to Visual Computing. Dr. Fabian Beck, member of the Visualization Research Center of the University of Stuttgart (VISUS) and associated to SFB-TRR 161, presented his interesting work on a matrix-based visual comparison of time series sports data. As part of the VMV 2016, the SFB-TRR 161 co-organized a workshop session titled “Quantification – useful and needed?”. Three leading german researchers of the visual computing community were invited to present their take on the role of quanitification in their respective fields of expertise.
Programmers’ Signposts
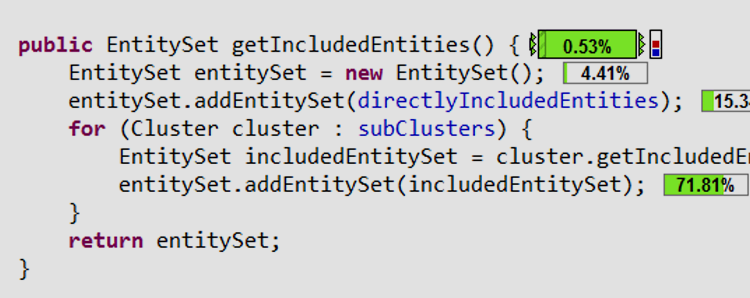
Have you ever felt lost in a foreign city? Software engineers know that feeling when they navigate through unfamiliar code. It might sound like a trivial problem, but studies have shown that they spend about 25% of their time just on code navigation. We – a group of researchers from the University of Stuttgart Visualization Research Center (VISUS) – have developed signposts for software engineers. Just like real signpost, ours intend to guide software developers through the code, providing data to make informed decisions where to turn next.