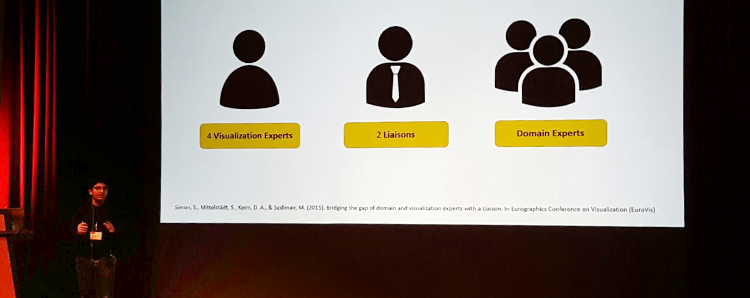
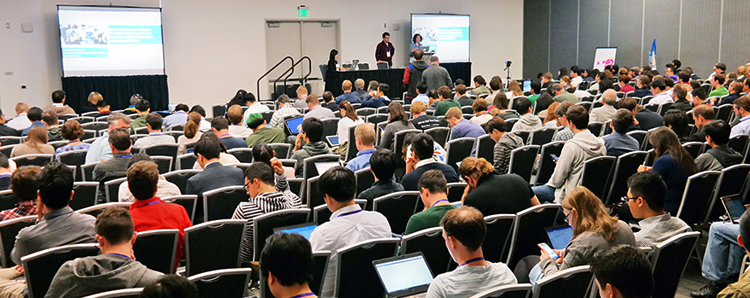
Last month I had the pleasure to attend the ETRA 2016 symposium in Charleston, USA. This conference focuses on all aspects of eye movement research across a wide range of disciplines. Computer scientists, engineers and behavioral scientists come together to bring their common vision of moving eye tracking research and its application forward, and expanding its impact. This year many good and interesting talks were held during the conference and now I want to talk about two papers I found particularly interesting.
Untangling Networks – or How to Focus on Less to See More
Can you imagine the social connections people had at the beginning of the 20th century? They had their family and a strong connection to neighbors. Most probably friends were living in the same village or in the next town. You could have painted a bubble for each person you knew on one sheet of paper and even would have had room enough to put the name in the middle – a network easy to analyze. One century later we are dealing with huge networks that allow us to model and study many real world phenomena since they are capable of representing pairwise relations between the items of interest. Arlind Nocajs’ graduate thesis “Untangling Networks: Focus on Less to See More” emphasizes certain aspects using various visualization techniques and graph drawing methods.
The Surface of Baden-Württemberg at Very High Resolution
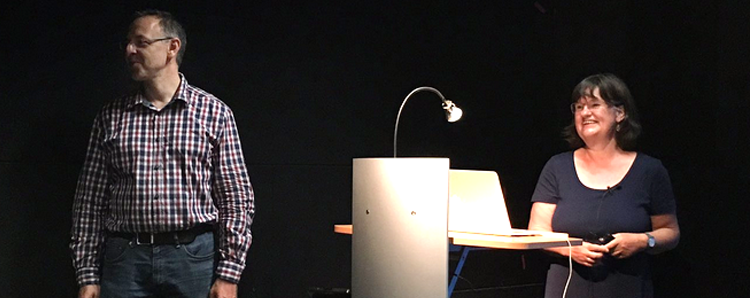
How did the formation of our landscape develop? Where did existing dolines and terraces arise? And why are there special valley configurations, meander or further landscape shapes, for example dunes directly in Baden-Württemberg? These are only some of the questions geology scientists like Prof. Hartmut Seyfried and his research assistant Elena Beckenbach (Institute of Planetology, University of Stuttgart) try to answer in their research work. Recently they presented their newest results based on a new visualization of the landscape of Baden-Württemberg to members of the Office for Geo-Information and Land Development (LGL) at the Powerwall of the Visualization Research Center of the University of Stuttgart (VISUS).
A Robot Learns to Paint Like a Human Artist
In January a group of artists and students from the Massachusetts Institute of Technology (MIT), Cambridge (USA), visited the Computer Graphics Group of the University of Konstanz (Prof. Deussen) to evaluate e-David, our painting robot. Together with Benjamin Tritt, a well known American Artist, they analyzed the different methods of painterly abstraction.
The Challenges of Designing Metro Maps
Maps for public transport as busses, subways or trains are part of our daily live. It is self-evident for most of us to read them and we expect them to be designed in a way that we can plan our journeys easily. But who cares about the usability and the design? And how can we be guaranteed that the map design invokes an accurate action by the passengers? Design experts and visualization researchers are working closely together to produce readable and effective map designs.
Making group structures visible
Whenever we want to change things and strive for new visions, we have to understand an existing system in the first place. For that purpose scientists are working on extensive tests and studies, they take measurements and collect statistical data. The more understandable and evident their data collections are, the easier they will gain new findings and subsequently explain their results and ideas to others. With increasing complexity of the data and considering that properties and parameters may change over time, it becomes difficult to analyze the data manually. Visual computing scientists work on new applications and new methods for a better handling of this data using software systems.
Scientific Literature Collections Explored Visually
It is daily business for researchers across all disciplines to search for, read, and structure scientific publications. Over the years, they become experts in a specific area, having an overview of hundreds of publications within this domain. To share their knowledge, they eventually publish a literature overview in form of state of the art report or part of a book or thesis. These overview publications structure and aggregate the literature on a high level of abstraction. However, they do not yet provide an interactively explorable list of publications leveraging the detailed knowledge of the authors.
What is Visual Computing?
Smartphones take our holiday pictures, send a reminder of upcoming appointments, and help us find the way to a meeting point. Cars are learning to see, computer generated images entertain us in cinemas and video games, and we view new products online in 3D before purchase.
ETVIS 2015 – First Workshop on Eye Tracking and Visualization
As part of IEEE VIS 2015 the SFB-TRR 161 co-organized the first workshop on eye tracking and visualization to bring together researchers from visualization, experimental psychology, and human computer interaction. With over 60 participants the workshop was very well attended and the afternoon meet-up extended the discussions.
Visual Computing BLOG – Online Platform for Visual Computing Research
Individuals, companies, organizations, and governments deal with information and data on a daily basis, in professional and private contexts. One of our great challenges is to extract the relevant information from ever increasing amounts of data produced by sensors, simulation, or as output from databases and information systems. Visual presentation is one of the key elements in extracting and communicating information. With this Visual Computing BLOG, we want to discuss fundamental questions of visual computing and the latest research developments.