Our last post was about presentations at IEEE VIS 2016 in Baltimore. Apart from the already mentioned publications, there were more presentations by SFB-TRR 161 scientists at the conference.
IEEE VIS 2016 in Baltimore
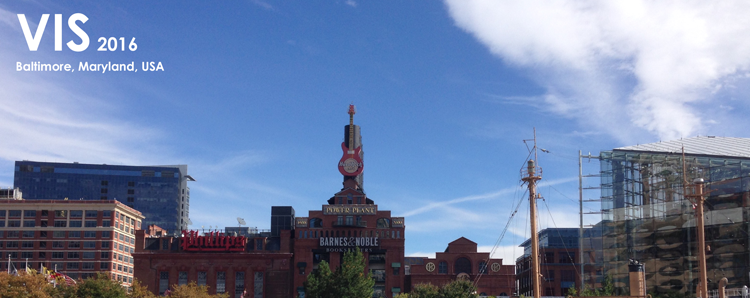
This year, the IEEE VIS conference took part in Baltimore, Maryland which is also dubbed ‘Charm City’ by the locals. The conference was held in the Baltimore Convention Center, at the Hilton Hotel. The location is situated not far from the Inner Harbor of Baltimore, a very nice and scenic place. The conference consists of three tracks (InfoVis, SciVis & VAST). Additionally, there are many workshops and tutorials.
Three Months in Calgary
This summer, I spent three months at the Ilab at the University of Calgary. My supervisor Sheelagh Carpendale is head of the InnoVis group which is part of the Ilab. I had the opportunity to visit the Ilab through the MIN Program: Mentoring International for Female Natural Scientists at the University Konstanz and which was funded by the Transregional Collaborative Research Center (SFR-TRR) 161. During my time, I worked with five great researchers evaluating a website developed and designed by them.
What is Neuroergonomics?
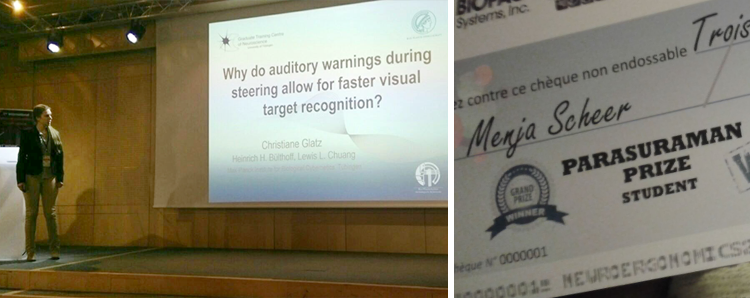
A motley crew of psychologists, neuroscientists, clinicians, engineers, computer scientists and other specialists congregated in an unlikely place – the headquarters of AXA Life Insurance in Paris, France. It was the 1st International Neuroergonomics Conference. What is Neuroergonomics? More importantly, do we need more conferences to attend?
Conference Report from VMV 2016
This year’s 21st Symposium on Vision, Modelling and Visualization (VMV) was hosted by the University of Bayreuth. International scientists presented their newest research in various sessions related to Visual Computing. Dr. Fabian Beck, member of the Visualization Research Center of the University of Stuttgart (VISUS) and associated to SFB-TRR 161, presented his interesting work on a matrix-based visual comparison of time series sports data. As part of the VMV 2016, the SFB-TRR 161 co-organized a workshop session titled “Quantification – useful and needed?”. Three leading german researchers of the visual computing community were invited to present their take on the role of quanitification in their respective fields of expertise.
Online Study in Graph Visualization – Participants wanted!
We are currently running an online study in the field of graph visualization. We hypothesize an optimum in the ratio of node size and edge width in node-link-diagrams. This study is wrapped in two online games, which are based on such node-link-diagrams. Here, we still need more played games. You do not need to have special knowledge about Graph Theory or similar, you only need to operate your mouse.
A Short Research Trip to VISUS
This summer was a bit different to me than for the rest of my colleagues at Visual Analytics and Imaging (VAI) Lab Stony Brook University and SUNY Korea, as I spent it in Visualization Research Center of the University of Stuttgart (VISUS) for a short research trip. I got this opportunity through the PhD fellowship program, offered by the Transregional Collaborative Research Center (SFR-TRR) 161. I carried out my research in Stuttgart, with many Ph.D.’s and Post-Doc’s at single place and which was definitely a learning experience for me. The whole experience was very different for me but indeed fruitful.
How do people perceive buildings in virtual 3D cities?
Nowadays, we increasingly deal with navigation systems to find our way to unknown places, or have a look at digital maps or street views to get a first impression of places we have never been before. As the computational hardware and software conditions are constantly improving, the applications and their underlying building models do with increasing geometric complexity and detailed textures. But by creating new systems that use virtual city models, we always have to keep one question in mind: What kind of representations do we really need to understand the inherent information? Within our research we want to get a deeper understanding of the human’s cognitive experience of virtual 3D cities.
Programmers’ Signposts
Have you ever felt lost in a foreign city? Software engineers know that feeling when they navigate through unfamiliar code. It might sound like a trivial problem, but studies have shown that they spend about 25% of their time just on code navigation. We – a group of researchers from the University of Stuttgart Visualization Research Center (VISUS) – have developed signposts for software engineers. Just like real signpost, ours intend to guide software developers through the code, providing data to make informed decisions where to turn next.
Back from SAP 2016 and SIGGRAPH 2016
Last month I had the pleasure to attend the conferences SAP 2016, an international conference on applied perception, and SIGGRAPH 2016, the top conference for Computer Graphics and Interactive Techniques, in Anaheim, USA. Both conferences were co-located to promote the communication between the core perception and computer graphics communities. At SAP I presented my work “Emotion Recognition in Autism Spectrum Disorder: Does Stylization Help?” Afterwards I hat the chance to attend SIGGRAPH.