Programmers’ Signposts

Programmers’ Signposts

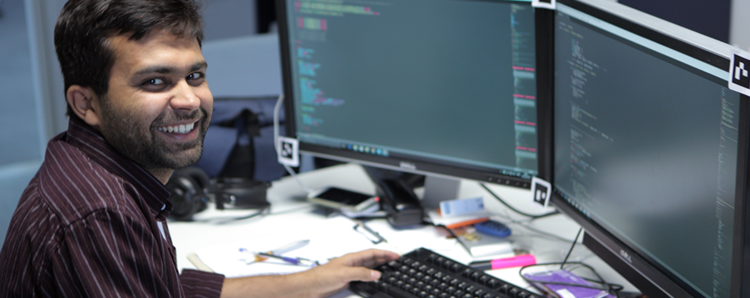
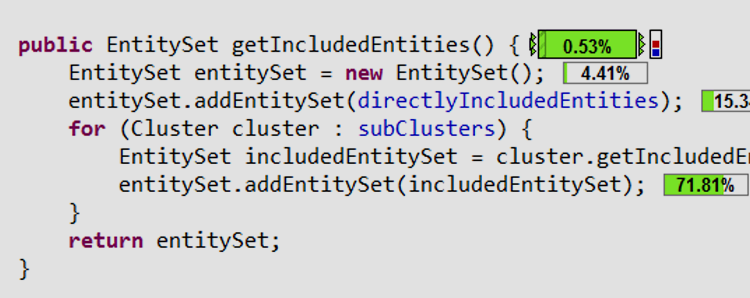
Have you ever felt lost in a foreign city? Software engineers know that feeling when they navigate through unfamiliar code. It might sound like a trivial problem, but studies have shown that they spend about 25% of their time just on code navigation. We – a group of researchers from the University of Stuttgart Visualization Research Center (VISUS) – have developed signposts for software engineers. Just like real signpost, ours intend to guide software developers through the code, providing data to make informed decisions where to turn next.

Back from SAP 2016 and SIGGRAPH 2016

Back from SAP 2016 and SIGGRAPH 2016

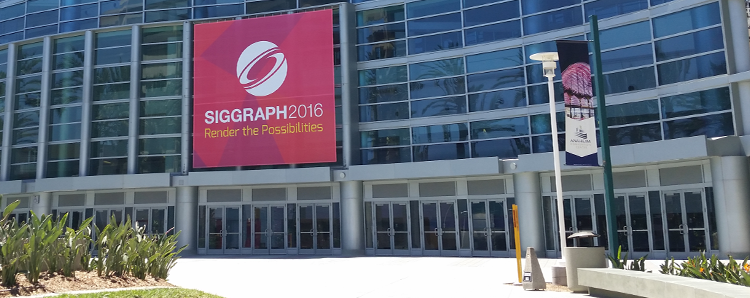
Last month I had the pleasure to attend the conferences SAP 2016, an international conference on applied perception, and SIGGRAPH 2016, the top conference for Computer Graphics and Interactive Techniques, in Anaheim, USA. Both conferences were co-located to promote the communication between the core perception and computer graphics communities. At SAP I presented my work “Emotion Recognition in Autism Spectrum Disorder: Does Stylization Help?” Afterwards I hat the chance to attend SIGGRAPH.

Eye Tracking – The Next Big Thing for Automatic Driving

Eye Tracking – The Next Big Thing for Automatic Driving

Nowadays a big vision of the automotive industry is autonomous driving. Since Google’s introduction of autonomously driving cars, car manufacturers, their suppliers, but also IT companies and the scientific community are excited about the upcoming revolution of transportation. The biggest advantages of autonomous driving are a higher driving comfort, and assumed the driving systems work reliably, a better driving safety. But there are many issues that have to be resolved until autonomous driving can be fully realized.

Provenance: On and Behind the Screens

Provenance: On and Behind the Screens

Melanie Herschel and I gave a tutorial at this year’s ACM SIGMOD conference in San Francisco. ACM SIGMOD is one of the important conferences in the field of data engineering and management. Our tutorial with the title “Provenance: On and Behind the Screens” covered the two topics provenance and visualization, and discussed how provenance information can be visualized.

Improve Image Compression by Using Human Visual Attention Property

Improve Image Compression by Using Human Visual Attention Property

Humans are the end users of visual media. Therefore, in order to develop an effective quantitative assessment of visual computing quality, one must take into account how humans perceive visual quality. For example, in image compression, an adaptive bitrate allocation that favors the image foreground can be expected to increase the visual quality of decoded images.

A Visual Analysis of Political Debates

A Visual Analysis of Political Debates

Political scientists, linguistis and computer scientists at the University of Konstanz developed an automatic system for the analysis and visualization of political communication. Their software – a result of the interdisciplinary BMBF-funded project VisArguea – allows to draw conclusions with respect to the deliberative quality of political discourse. One use case is the Stuttgart 21 mediation which took place in 2010 and aimed at resolving the conflicts around the railway and urban development project in Stuttgart (Germany).

EuroVA and EuroVis 2016 in Groningen, Netherlands

EuroVA and EuroVis 2016 in Groningen, Netherlands

In early June I had the opportunity to join this years EuroVis in Groningen in the Netherlands. This conference is in the top two academic events when it comes to visualization and visual analytics, so I was excited to being able to attend this event. Together with colleagues from the University of Konstanz I enjoyed a week of learning about the latest research in the field, meeting and socializing with experts from around the globe.

Visualization of Eye Tracking Data

Visualization of Eye Tracking Data

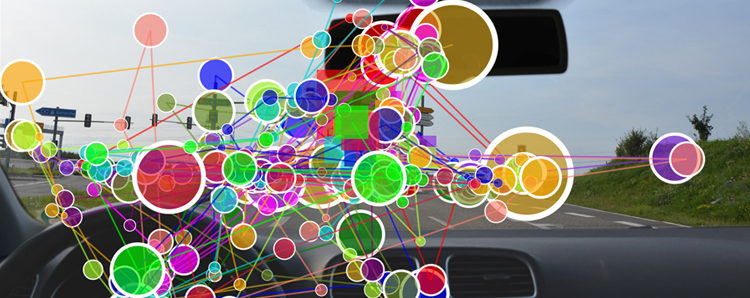
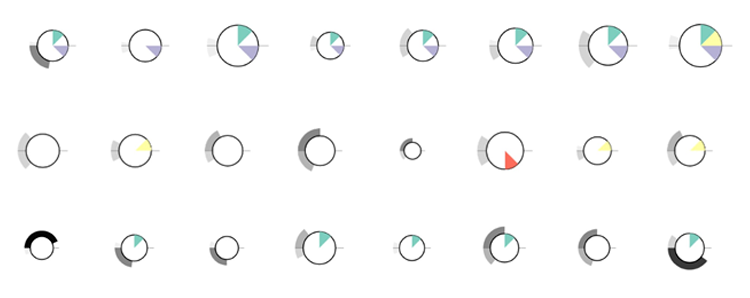
Knowing where people look at when they investigate visual stimuli such as pictures and video content provides valuable information for multiple application scenarios. The investigation of viewing behavior has become a popular approach that provides a glimpse into the human mind. May it be a person sitting in front of a computer screen or walking in the park, different eye-tracking devices can record where and how long a person spent visual attention for nearly all possible visual stimuli. Depending on the device, up to 2000 gaze positions per second and the visual stimulus can be recorded for an individual person. Typically, many more persons are recorded in a user study, and the goal is to compare this massive amount of data in order to find similarities as well as outliers in the viewing behavior.