In July 2022, Florian Frieß defended his PhD thesis on “Interactive Remote-Visualisation for large Displays”. On our blog, he summarizes his findings.
Interactive Remote-Visualisation for Large Displays
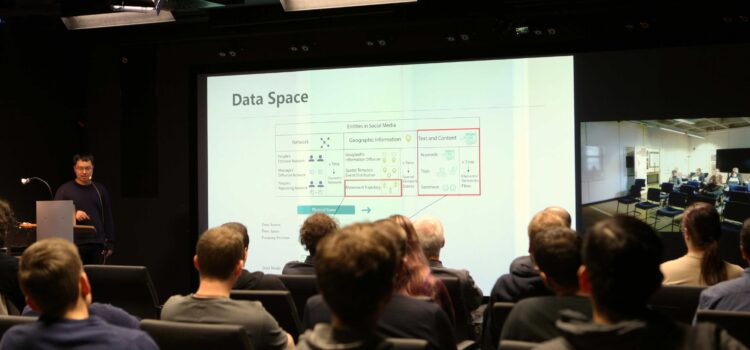


In July 2022, Florian Frieß defended his PhD thesis on “Interactive Remote-Visualisation for large Displays”. On our blog, he summarizes his findings.
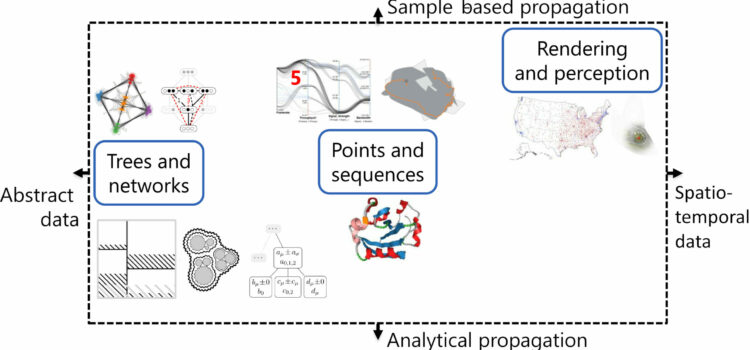
Christoph Schulz recently completed his thesis with the title “Uncertainty-aware Visualization Techniques”. On our blog, he summarizes his thesis.
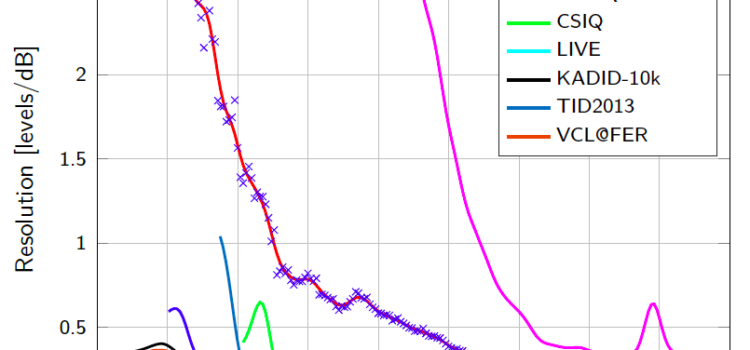
In April 2022, Hui Men successfully defended her Ph.D. thesis with the title “Boosting for Visual Quality Assessment with Applications for Frame Interpolation Methods”.
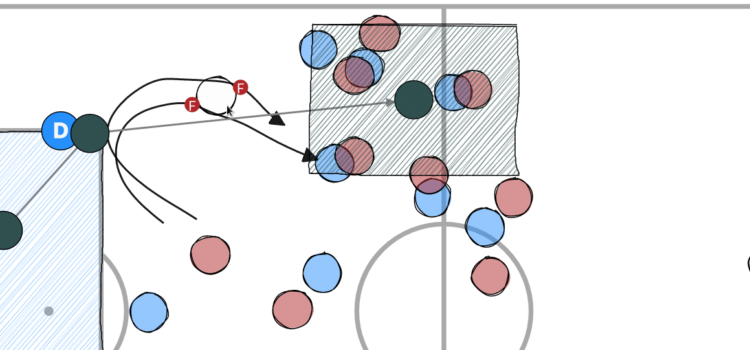
In December 2021, Daniel Seebacher successfully defended his doctoral thesis on “Visual Analytics of Spatial Events: Methods for the Interactive Analysis of Spatio-Temporal Data Abstractions”.
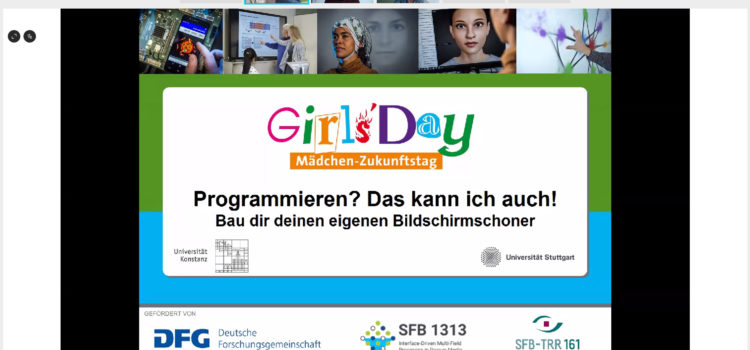
Der Girl’s Day war dieses Jahr ein Gemeinschaftsprojekt vom SFB-TRR 161 und dem SFB1313, und im speziellen eine Kooperation der Uni Konstanz und der Uni Stuttgart. Insgesamt bildeten wir ein 8-köpfiges Team, dass sich dieses Jahr der Herausforderung stellen musste den Girl’s Day online zu gestalten.
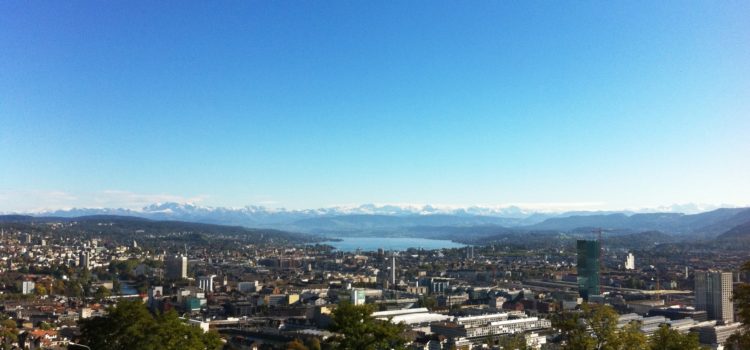
Doctoral researcher Christoph Schulz spent three months at the ETH Zurich working on order-statistical measurements for graphs and networks to assess representativeness.
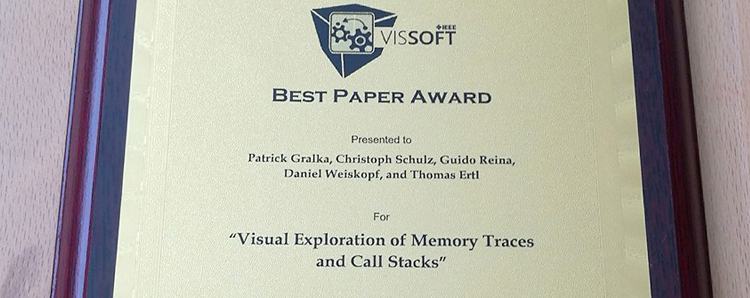
At the software visualization conference VISSOFT, we presented a tool for tracing memory access patterns of arbitrary applications at runtime and then doing post-mortem visual analysis. The purpose of this visualization is to help developers finding hints for optimization of their code regarding memory usage. This is important for many applications in the area of high-performance computing, especially because the gap between processor and memory speeds continues to grow. Thus, memory accesses pose a bottleneck for performance-critical applications.
Every year in autumn, researchers and practitioners from academia, government, and industry come together at IEEE VIS to explore their shared interests in tools, techniques, and technology. Among them, there was also a group of visual computing researchers from the Universities of Stuttgart and Konstanz. They visited this scientific meeting to present their newest insights and developments in the field of Visual Computing. In this blog post you find a list of the their publications presented to the international community.
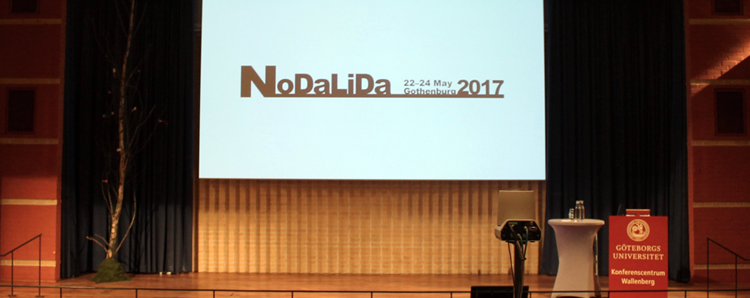
This year, the Nordic Conference on Computational Linguistics (NoDaLiDa) took place from 22-24th May in Gothenburg, Sweden. The 21st edition of NoDaLiDa was also the 40th anniversary of the conference which was celebrated by 184 participants from all over the world.
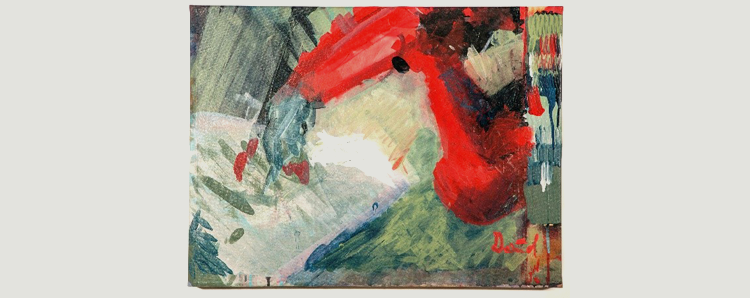
Since October 2015 I have been in contact with Prof. Oliver Deussen, who since 2010 has been developing the e-David, a robotic Drawing Apparatus for Vivid Interactive Display, at the University of Konstanz. Subsequent to the first encounter at the Massachusetts Institute of Technology (MIT), I visited Prof. Deussen and his team at their lab in Konstanz, to continue to discuss and re-evaluate the potential use of the robot from an artistic and creative perspective.