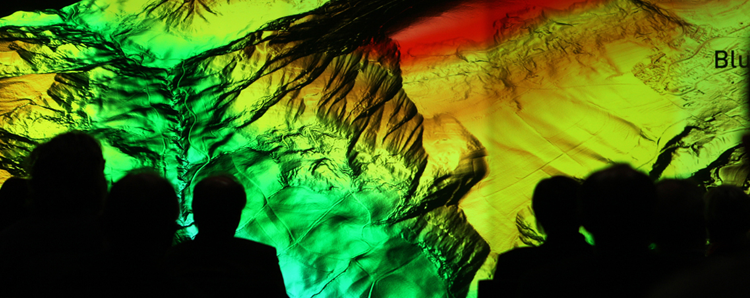
How did the formation of our landscape develop? Where did existing dolines and terraces arise? And why are there special valley configurations, meander or further landscape shapes, for example dunes directly in Baden-Württemberg? These are only some of the questions geology scientists like Prof. Hartmut Seyfried and his research assistant Elena Beckenbach (Institute of Planetology, University of Stuttgart) try to answer in their research work. Recently they presented their newest results based on a new visualization of the landscape of Baden-Württemberg to members of the Office for Geo-Information and Land Development (LGL) at the Powerwall of the Visualization Research Center of the University of Stuttgart (VISUS).
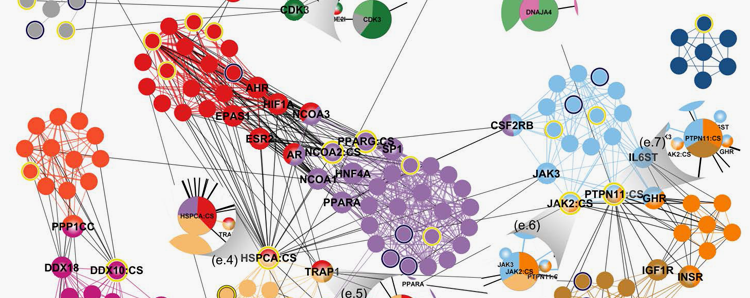
Making group structures visible
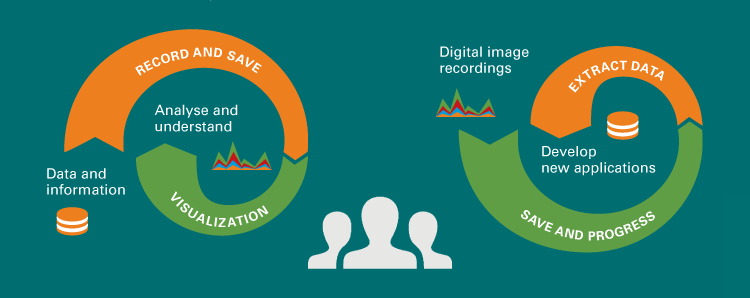
Whenever we want to change things and strive for new visions, we have to understand an existing system in the first place. For that purpose scientists are working on extensive tests and studies, they take measurements and collect statistical data. The more understandable and evident their data collections are, the easier they will gain new findings and subsequently explain their results and ideas to others. With increasing complexity of the data and considering that properties and parameters may change over time, it becomes difficult to analyze the data manually. Visual computing scientists work on new applications and new methods for a better handling of this data using software systems.
What is Visual Computing?
Smartphones take our holiday pictures, send a reminder of upcoming appointments, and help us find the way to a meeting point. Cars are learning to see, computer generated images entertain us in cinemas and video games, and we view new products online in 3D before purchase.