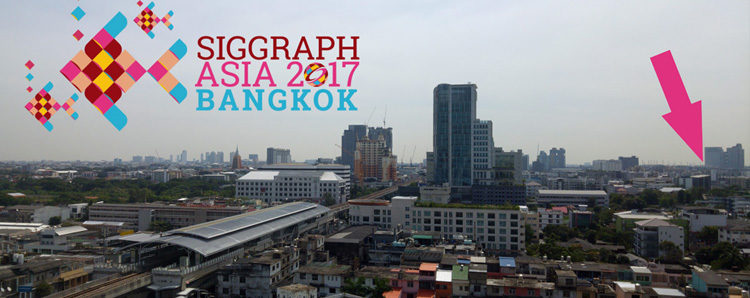
The SIGGRAPH Asia 2017 conference was held in Bangkok. It attracted many interested visitors from industry, education and other fields. The conference is mainly about rendering, graphics and animation. However, there is also a small Symposium on Visualization (SA17VIS) for researches from visualization and more graphics intensive backgrounds to meet and exchange ideas. During this symposium we had the change to present our paper “Visual Exploration of Mainframe Workloads”.
How can we Visualize Large Amounts of Performance Data with Conventional Infovis Techniques?


