Data visualization is a powerful tool to efficiently and effectively extract knowledge from data and gain insights through interactive analysis procedures. For each data and task, there are different visualization techniques that are optimal for the particular analysis procedure.
However, not only the visualization can affect the task – but also how the visualization is observed. It makes a huge difference if the data is analyzed on the small displays of smartphones, on standard monitor screens, on huge powerwall displays comparable to the size of cinema screens, or – what is a more recent development – in so-called immersive environments.
In immersive environments, the real environment is augmented or replaced by virtual elements, allowing a high degree of freedom in the design of analysis environments, visualizations, and interaction concepts. Immersive analytics comprises analysis procedures that make use of such immersive and more engaging media. Currently, one of the biggest problems in immersive analytics is that the added value of immersive devices, for example, compared to conventional monitor screens, is not clearly defined. There is no common set of rules to determine, for instance, when it makes sense to use virtual reality (VR). This is because the technology is relatively new and constantly evolving. Therefore, a regularly recurring challenge is to evaluate such immersive environments for information visualization applications and to answer the question of whether and how the deployment of virtual reality makes sense for a given combination of data, task, and visualization.

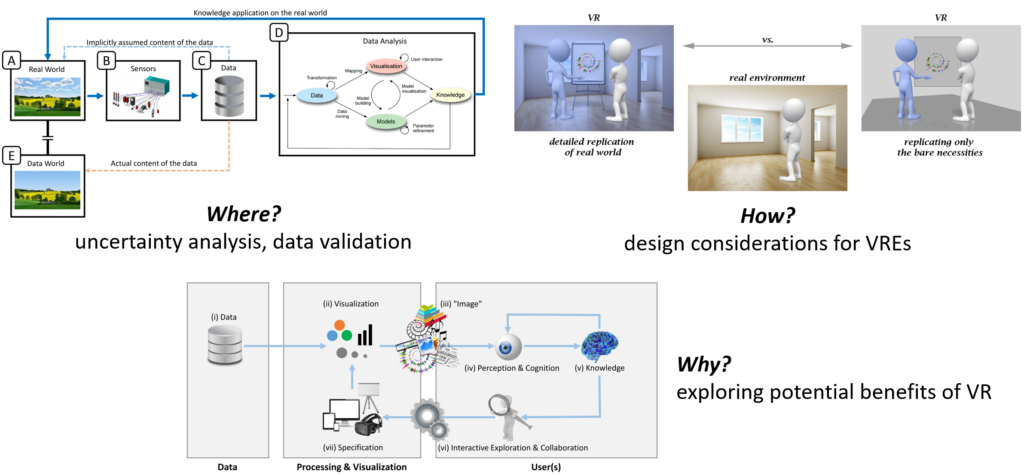
In our research, we identified three different strategies on how the assessment of added value through virtual reality can be carried out. The first is based on logical reasoning using deductions from literature to justify the use of immersive media without an evaluation in the classical sense (see Figure 1). As a side effect, this approach can reveal research gaps and indicate which research directions are promising and should be further investigated.


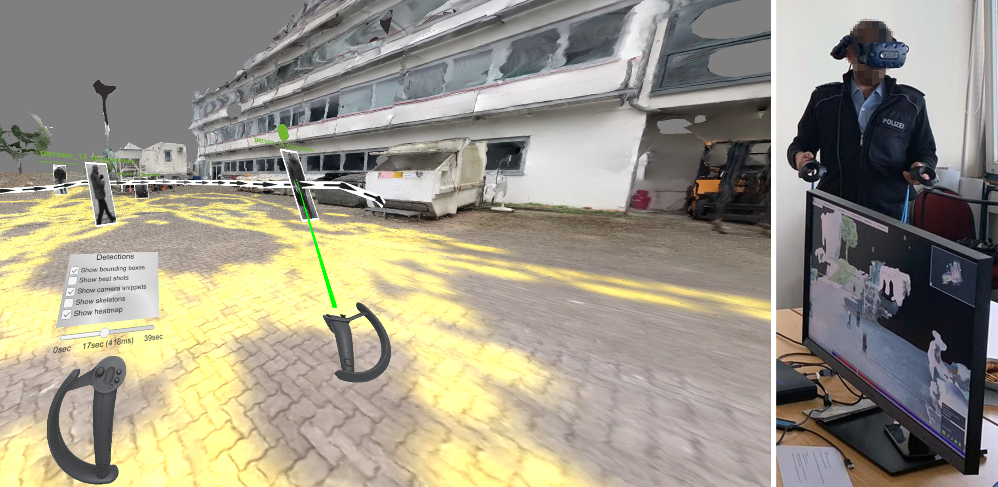
The second strategy examines a single property that is affected by immersive environments (see Figure 2). As exemplary evaluations, two human factors, namely immersion and orientation, are considered and assessed in quantitative user studies. The third strategy involves holistic evaluations of immersive analytics applications. The implementation of this strategy is illustrated by means of a qualitative and a quantitative evaluation of two applications.


In our work, we investigated all three strategies and discussed their value in terms of the sustainability and generalizability of their results. To date, immersive analytics has been subject to relatively little research, in part because it is a rapidly evolving field. Our research is intended to help fill various research gaps by highlighting different approaches to where and how virtual reality can and cannot be put to good use.

