
At the software visualization conference VISSOFT, we presented a tool for tracing memory access patterns of arbitrary applications at runtime and then doing post-mortem visual analysis. The purpose of this visualization is to help developers finding hints for optimization of their code regarding memory usage. This is important for many applications in the area of high-performance computing, especially because the gap between processor and memory speeds continues to grow. Thus, memory accesses pose a bottleneck for performance-critical applications.
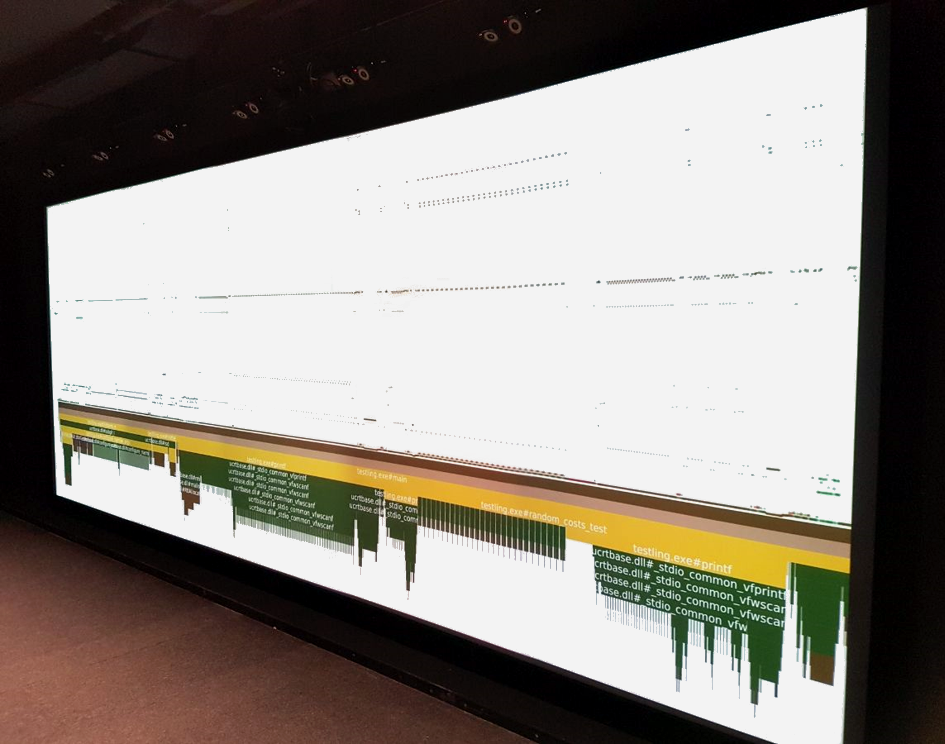
Analyzing memory accesses in the high-level source code is difficult and requires knowledge about compiler optimizations, vectorization, or different cache layers. At machine code level, it is clearer which instructions access memory. Therefore, we developed a tracing tool based on the DynamoRIO framework to instrument machine code at runtime. We trace not only information such as addresses and sizes of accessed memory, but also function calls to provide source code context to relate memory accesses to user code. The traced information is processed and presented within the MegaMol framework. We depict each individual memory access as a point in a scatterplot with the accessed address plotted over execution time. Here, the difficulty is the 64-bit address range, which exceeds the number of pixels available by several magnitudes. Moreover, the address range is only sparsely occupied. Thus, we use a clustering algorithm to identify empty address ranges, which we collapse in the plot. We decorate the x-axis of the scatterplot, representing execution time, with a flamegraph depicting the call stack evolution. It enables the user to relate individual memory accesses to the source code.
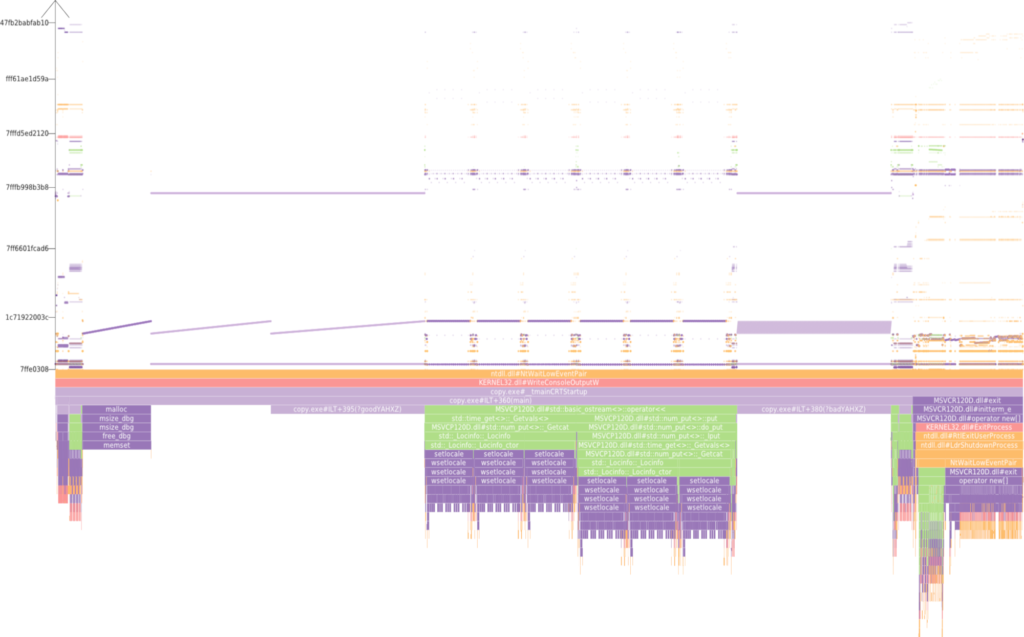
In summary, our approach shows that access patterns of typical algorithms are clearly visible. Thus, users can reason about the quality of memory usage, such as cache efficiency, of their algorithms, and use our tool to identify opportunities for performance optimization.
Reference:
Gralka, Patrick; Schulz, Christoph; Reina, Guido; Weiskopf, Daniel; Ertl, Thomas: “Visual Exploration of Memory Traces and Call Stacks“, 2017 IEEE Working Conference on Software Visualization (VISSOFT), Shanghai, 2017, pp. 54-63.