
It is daily business for researchers across all disciplines to search for, read, and structure scientific publications. Over the years, they become experts in a specific area, having an overview of hundreds of publications within this domain. To share their knowledge, they eventually publish a literature overview in form of state of the art report or part of a book or thesis. These overview publications structure and aggregate the literature on a high level of abstraction. However, they do not yet provide an interactively explorable list of publications leveraging the detailed knowledge of the authors.
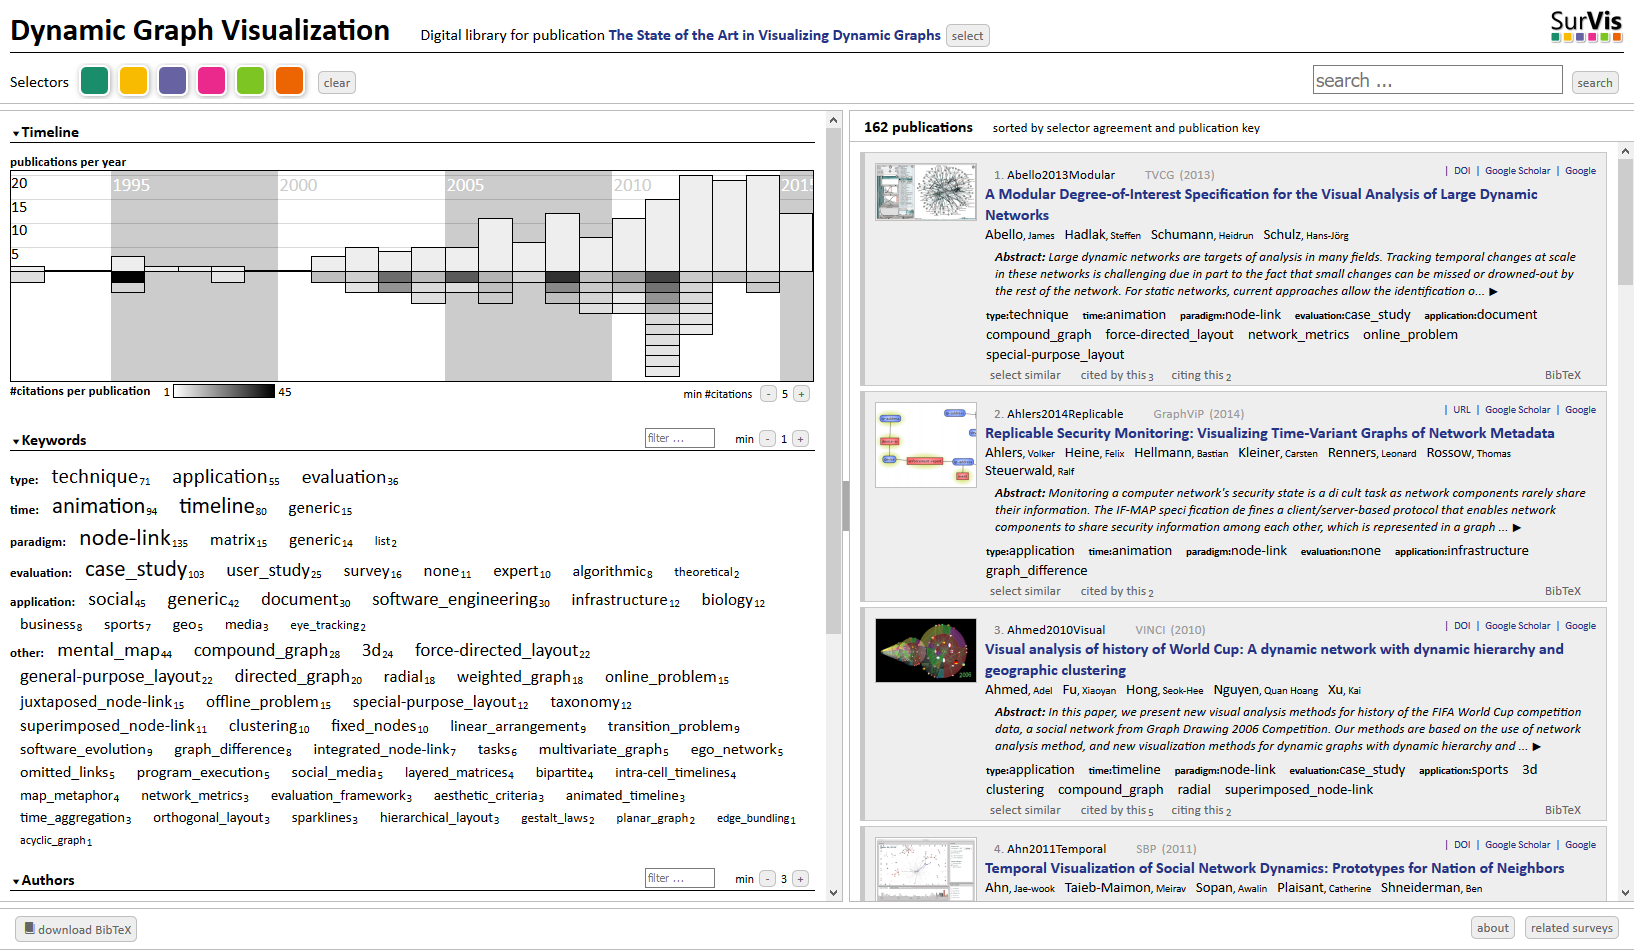
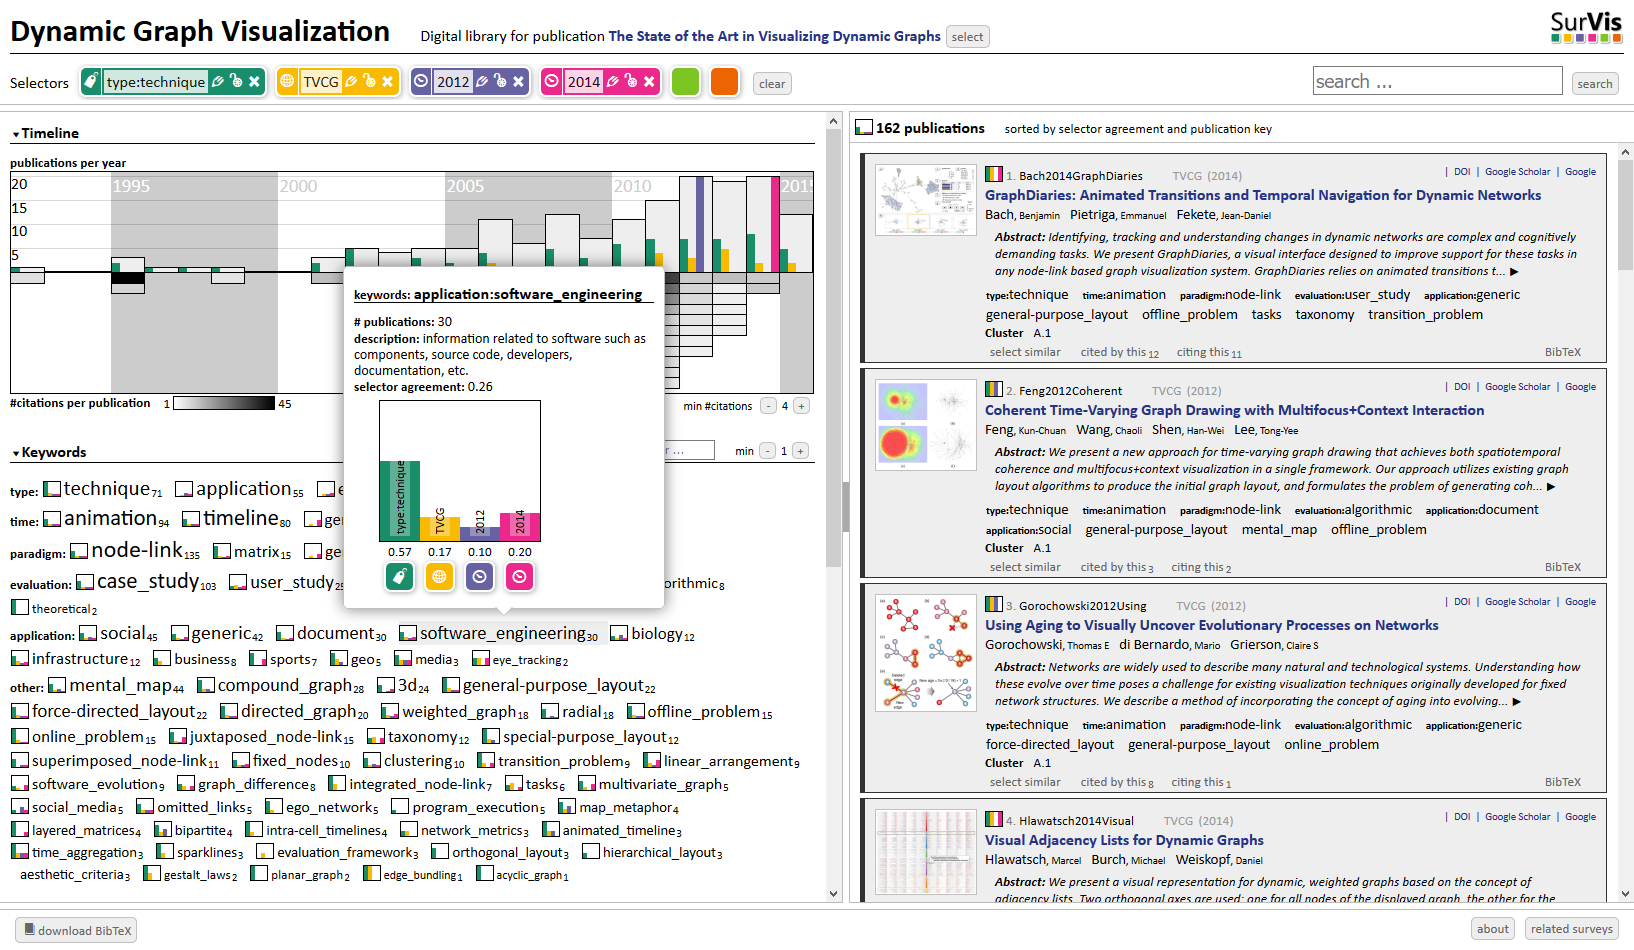
To extend the usefulness of literature overviews, researchers from the Visualization Research Center of the University of Stuttgart (VISUS) have developed SurVis, a Web-based system to support the analysis and dissemination of literature collections. This system not only provides means to quickly search and browse hundreds of publications, but also visualizes relationships between keywords, authors, and publication venues. A timeline gives an overview of historic developments and trends as well as citations. The system is designed to be very easy to use for readers interested in the respective literature collection. At the same time, SurVis provides smoothly integrated and powerful features that allow expert users to perform sophisticated analysis of the literature data.
The system was recently presented at IEEE VIS 2015 in Chicago, the leading scientific visualization conference, as part of the visual analytics track (VAST). SurVis is available as open source software. It is easy to install and use for your own literature collection.
Preview of the talk on Vimeo: https://vimeo.com/136206061
Project page on GitHub: https://github.com/fabian-beck/survis
Reference: Beck, F., Koch, S., & Weiskopf, D. (2016). Visual analysis and dissemination of scientific literature collections with SurVis. IEEE Transactions on Visualization and Computer Graphics, 22(1), 180-189. [PDF] [DOI: 10.1109/TVCG.2015.2467757]
Hello Fabian,
I read the paper and found it super interesting. I understood that data is come from BibTex files to which citations can be added. Is there any support for adding citations?; how would you recommend to do that task?
Best regards,
Thanks for the interest!
You could basically use any tool to edit the BibTeX file (e.g., JabRef). There is also some built-in support for editing in SurVis when you set ‘editable = true’ in the properties. I use it for editing and am extending the editing features, but there are still some features missing and you have to be careful to save your changes regularly (either to local storage or as a file).
Let me know if you have any feedback or feature requests.
Fabian