Visual data exploration helps users in finding interesting information in data sets when they do not know beforehand what useful information hides in their data. It thus supports humans in understanding and interpreting data in an investigative way. Typically, visual data exploration systems assume that users have the prerequisite knowledge to issue exploration queries and to construct suitable visualizations to render their results. However, in practice these tasks are usually time-consuming, making manual visual data exploration a tedious and time-consuming process. Clearly, this is not convenient in real life scenarios where users often have limited time for visual data exploration.
To cope with this problem, we have proposed in this work a set of new recommendation approaches supporting users alongside the full process of exploration. These new recommendation methods bridge the gap between visualization and query recommendation for visual data exploration that were always considered in existing work separately in order to offer users a more efficient visual data exploration experience.
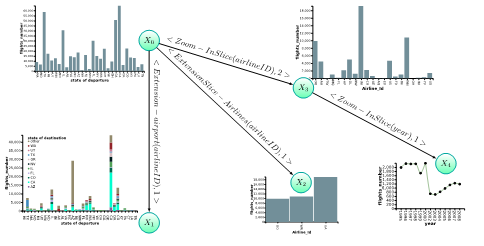
To do that, we have considered provenance to support various types of recommendations proposed to users alongside the visual data exploration process. In general, the provenance describes the production process of an end product, which can be anything from a piece of data to a physical object. In our context, provenance describes the different stages performed by users throughout the visual data exploration process. More specifically, we collect provenance of (previous) user explorations made by same or other users in the course of the visual data exploration process. This meta-data about user exploration sessions comprises users’ queries, users’ interactions and visual encoding parameters of rendered visualizations. We call it evolution provenance. A sample of our proposed evolution provenance is depicted in the following figure.

We model the evolution provenance as a directed acyclic graph (DAG) where nodes correspond to exploration steps made by users and edges represent the transition (the navigation) from an exploration step to another. The edges contain further information including the action/operation performed by the user to navigate from an exploration to another. The edges encompass also scores reflecting the relevance of adjacent exploration steps (nodes).
Based on collected evolution provenance traces, we propose in this work three novel recommendation approaches that are: (i) content-based query recommendation, (ii) collaborative-filtering query recommendation, and (iii) visualization recommendation.
The content-based query recommendation approach leverages data provenance of users’ interactions to identify information strongly related to users’ current focus. Beside taking into account users’ proper interests (via content-based query recommendation approach), we propose a novel query recommendation approach to take also into account global trends commonly opted previously by several users. This corresponds to our collaborative-filtering query recommendation approach.
Finally, we propose a visualization recommendation approach that recommends suitable visualizations to render query results. To do that, our visual recommendation approach leverages evolution provenance that tracks all manipulations performed by the current user.
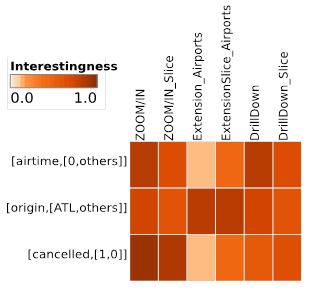
Given the high diversity and possibly large number of recommendations produced by our query recommendations approaches, we propose a quantification approach that measures the “interestingness” of each recommendation. The measure of recommendations interestingness relies on: (i) the deviation metric that compares the dissimilarity of recommendation’s data distribution with the data distribution in the whole explored dataset, and (ii) the popularity of the recommendation among previous explorations made on the same data warehouse by multiple users. The computed interestingness scores are visualized as an impact matrix, pointing thereby users to potentially interesting recommendations to investigate next. A sample of impact matrix is depicted in the following figure. The rows represent the set of relevant information (strongly related to the user’s interaction) identified by our query recommendation approaches. Columns of the impact matrix reflect various types of query’s recommendations supported in our work. Thereby, each cell maps to a recommendation. The cell color encodes the interestingness score of each recommendation.

We integrate and generalize our work through a provenance-based framework for visual data exploration that provides a holistic approach to support users in the whole process. Accordingly, our provenance-based framework for visual data exploration assembles our aforementioned contributions including evolution provenance capture, provenance-based recommendation approaches, and methods quantifying recommendation interestingness.
To provide evidences about the feasibility of our proposed framework, we implement EVLIN, an instance of our framework that targets the visual exploration of data warehouses. The architecture of EVLIN is depicted in the following figure.

In our work, we performed a series of evaluations to validate our contributions implemented in EVLIN. Overall, these contributions were evaluated both quantitatively using performance measurements and qualitatively with a user study on both synthetic and real data. Quantitative experiments show the feasibility and the efficiency of our proposed solutions for visual and interactive data exploration while qualitative evaluations show a general satisfaction among users when visually exploring data warehouses data using our system EVLIN.

