
During my research stay at InnoVis, University of Calgary, Canada (see my blog post Three Months in Calgary) I worked with Lindsay MacDonald Vermeulen, Jo Vermeulen, Charles Perin, Wesley Willett, Thomas Ertl, and Sheelagh Carpendale on a project, which recently was accepted to the IEEE Transactions on Visualization and Computer Graphics.
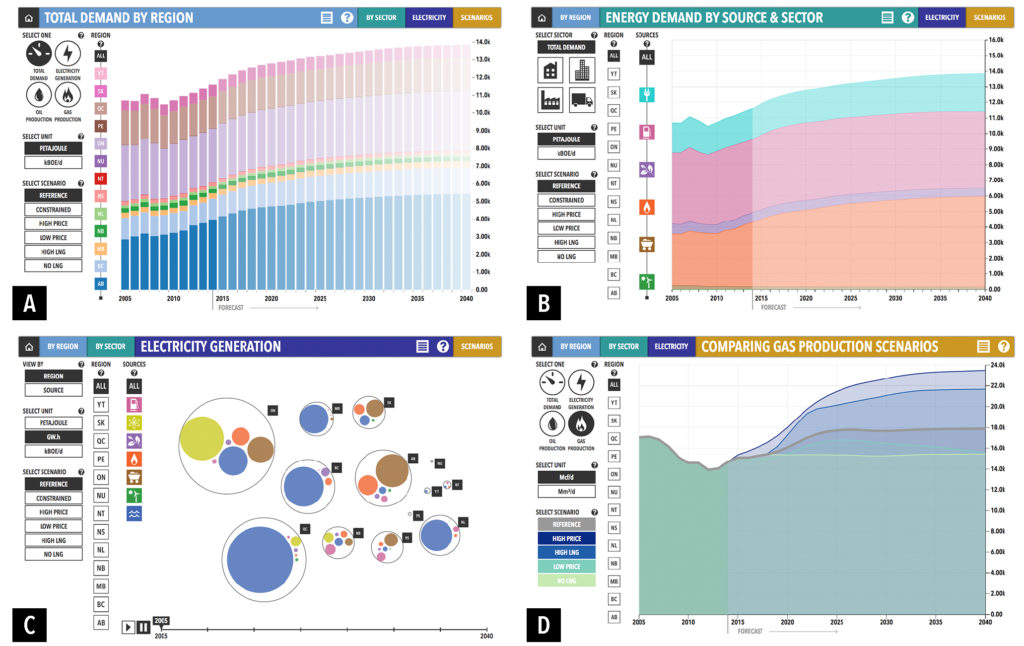
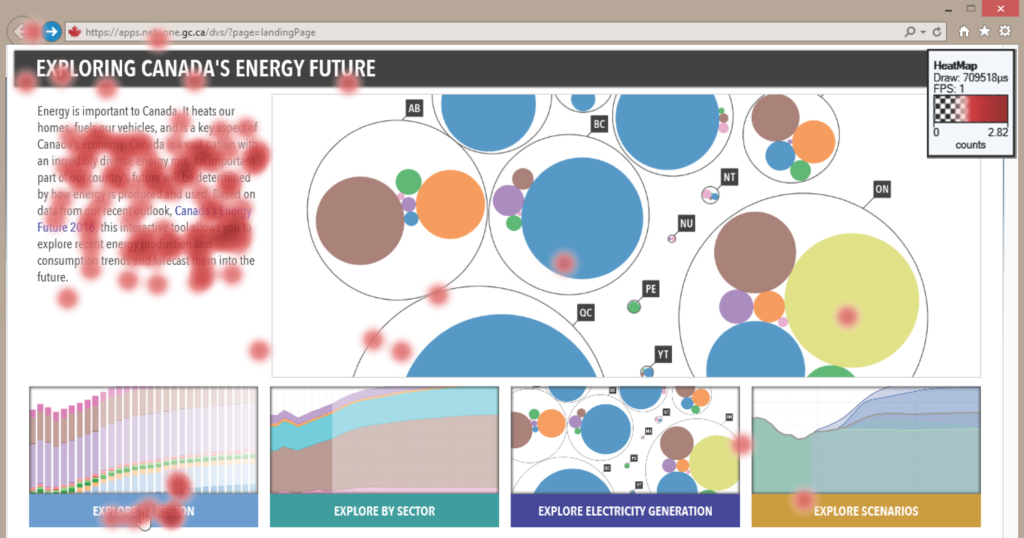
In our paper, Exploration Strategies for Discovery of Interactivity in Visualizations we investigated how people discover the functionality of an interactive visualization that was designed for the public. While interactive visualizations are increasingly available for public use, we still know little about how the public discovers what they can do with these visualizations and which interactions are available. Developing a better understanding of this discovery process can help inform the design of visualizations for the general public, which in turn can help make data more accessible. To unpack this problem, we conducted a lab study in which participants were free to use their own methods to discover the functionality of a connected set of interactive visualizations of public energy data. We collected eye movement data and interaction logs as well as video and audio recordings. By analyzing this combined data, we extract seven exploration strategies that the participants employed to discover the functionality in these interactive visualizations. These exploration strategies are eyes only, reading text, opportunistic interactions, entry points, structural interactions, permutation interactions, and leveraging the familiar.
When using the strategy Eyes Only, participants visually examine a view, but do not interact with it. By scrutinizing a view while preserving its current state, participants engaged in passive interaction – interactions that have no physical component, but constitute a complex visual and cognitive performance during which a viewer’s mental model changes. In our study, participants usually employed this exploration strategy when they were first exposed to a view or immediately after completing a sequence of interactions that altered the view.
Most participants also read the documentation provided by the visualization designers to help them understand a new view. Reading Text is slightly more interactive than eyes only, because aside from the entry text on the start page of the website, reading the available documentation on the web site required the participants to select a help button.
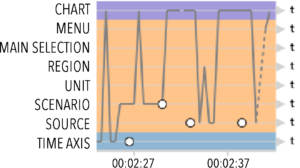
In our study, when participants Interacted Opportunistically, they typically selected a random option from any group of controls, examined the chart to assess what changes their action caused, and then relatively rapidly moved on to a different control. Opportunistic interactions are characterized by being free ranging, relatively effortless, and usually not carefully planned.
When using the strategy Entry Points, participants started their investigation with a view by gravitating towards familiar factors in the controls, the charts, or the content. These familiar factors served as entry points into the view. For example, several participants noted looking at the geographic region they grew up in or currently live in.
When using Structural Interactions, participants leveraged the structure that is visually apparent in the interface. For example, a participant would choose one control group and then iterate over all of the available options in that group. Participants often followed the spatial organization of the controls—for example, moving from top to bottom through the control group.
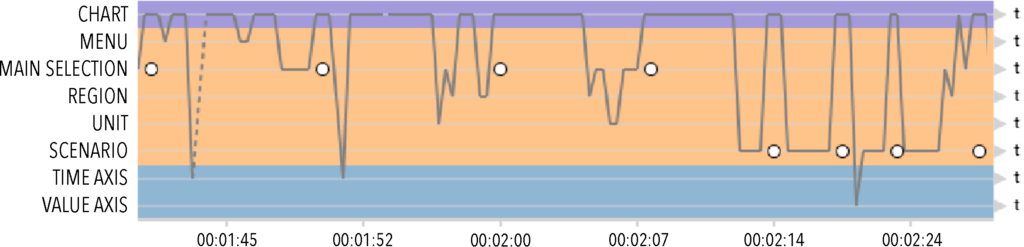
Permutation Interactions are a careful, methodical approach that reveals some understanding of the relationship between control groups. Similar to a comparative measure or dimension walk, participants would select one control item in a given control group (A) and then take a different control group (B) and iterate through all the options in B. Then, they would return to A, select a new item, and iterate through all the options in B again. We call this permutation interaction because in this manner participants could ensure that they had seen all permutations and combinations of the two Groups.
When using the Leveraging the Familiar, participants used their understanding of one view to learn about another view. We saw two variations of leveraging the familiar in our study. Sometimes participants would switch to a new view, and then quickly revisit the previous view in order to understand the differences between the two views. In other cases, participants would realize that something in their current view was different from what they had seen in a prior view and would return to that view to compare it with the current view.
Based on these exploration strategies we defined design directions for improving the discoverability of a visualization’s functionality. Ultimately, we hope that by understanding how people approach interactive visualizations, we can empower an even broader range of people to experience, interact with, and gain insight from open data.