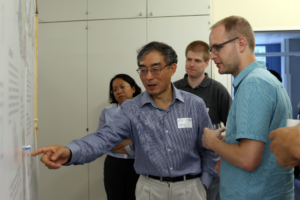
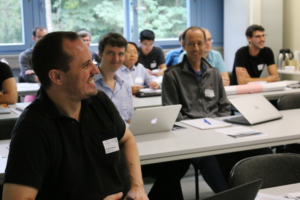
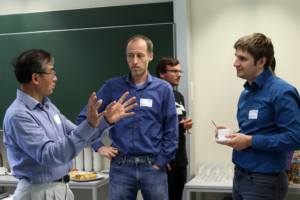
In July 2017 I joined the workshop Uncertainty Visualization – From Uncertain Data to Uncertainty Theory at the University of Konstanz. The aim of the workshop was to discuss the possibility to quantify the extend of perceived uncertainty transported by a visualisation.
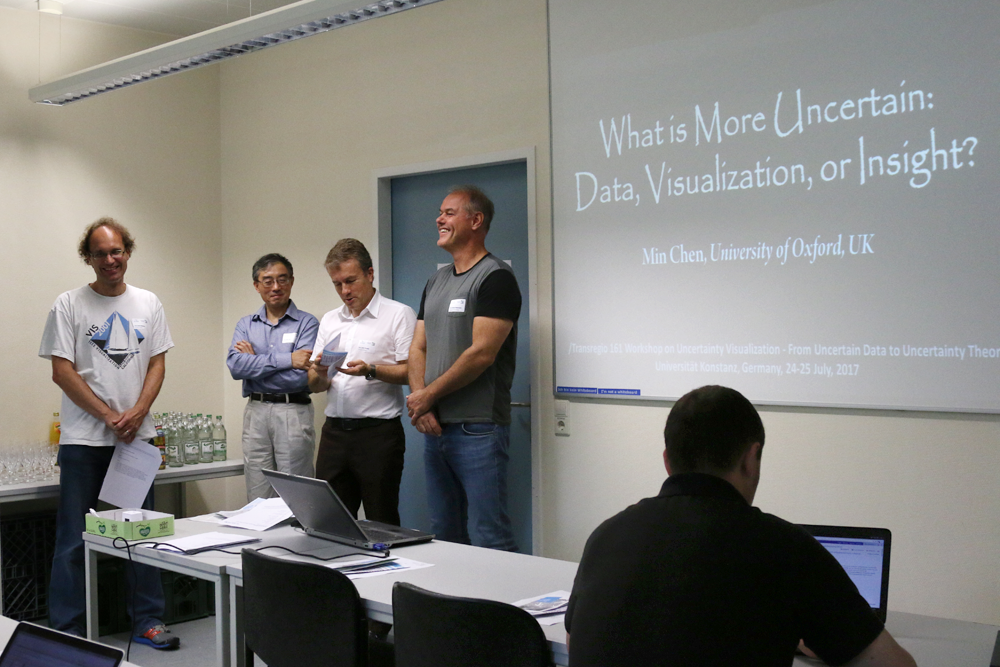
The programme consisted of three talks, a poster session with poster presentations from the PhD students and a group discussion about different topics in uncertainty visualisation. In addition to the scientific part, there was also a guided tour of Konstanz and dinner with all participants.
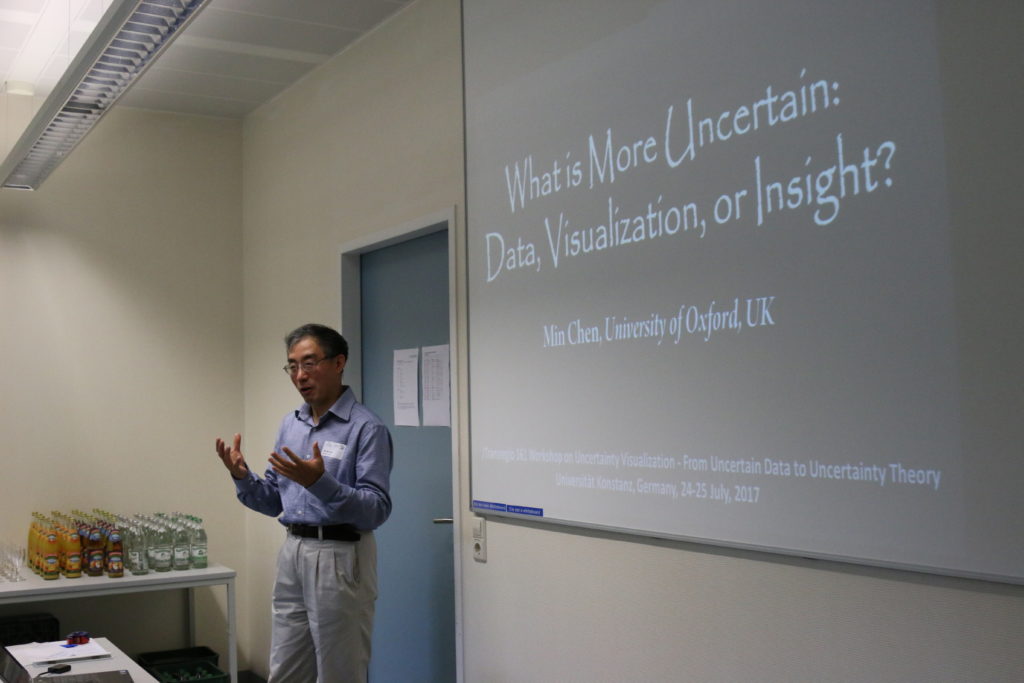
Prof. Min Chen from the University of Oxford, talked about a bottom up approach to explain the propagation of uncertainty from the data to the visualisation. He showed that the uncertainty typically decreases from the data alphabet, to the visualization alphabet, and further to the decision alphabet when the Shannon entropy is used to measure the uncertainty at different stages of a basic visualization process.
On the other hand, Prof. Daniel Keim, Professor for Data Analysis and Visualization at the University of Konstanz and principal investigator of Transregio project A03, used a model to explain the influence of uncertainty, within systems, on the trust the user has in the output. This model is more of a top down approach to explain the propagation of uncertainty within a system and led to a discussion about the two different approaches. The last talk was from Prof. Rüdiger Westermann from the Technical University of Munich and discussed the need for visualizing the uncertainty. In some cases, the uncertainty visualizations can obstruct important information.
The conclusion of the workshop was that there is still work to be done until we can quantify the extend of perceived uncertainty transported by a visualisation. In addition, the discussion about the two approaches, by Prof. Min Chen and Prof. Daniel Keim, showed that there is no perfect model that can explain the propagation of uncertainty from the data to the visualisation.

