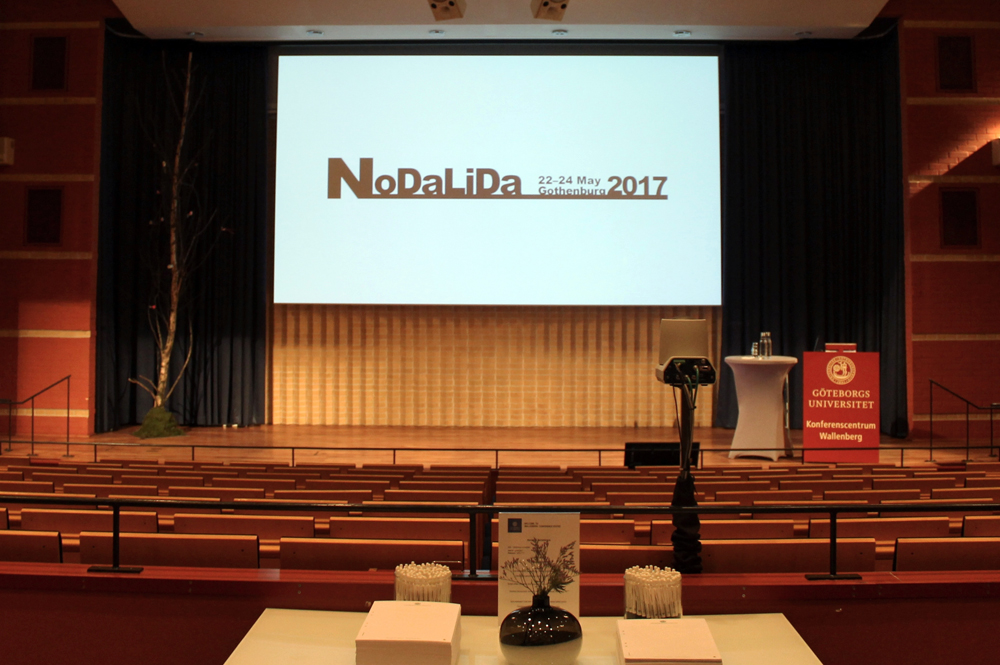
This year, the Nordic Conference on Computational Linguistics (NoDaLiDa) took place from 22-24th May in Gothenburg, Sweden. The 21st edition of NoDaLiDa was also the 40th anniversary of the conference which was celebrated by 184 participants from all over the world.

Before the start of the main conference, four different workshops took place simultaneously on Monday, May 22nd. I gave a talk in the workshop on Processing Historical Language which was organized by Gerlof Bouma and Yvonne Asedam. My talk presented work on the visualization of historical language change which is the outcome of the collaboration between project A03 (Quantification of Visual Analytics Transformations and Mappings) and D02 (Evaluation Metrics for Visual Analytics in Linguistics) within SFB-TRR 161. The title of the paper I presented was HistoBankVis: Detecting Language Change via Data Visualization co-authored by Michael Hund, Frederik L. Dennig, Miriam Butt and Daniel A. Keim.
HistoBankVis is a visualization system designed for the interactive analysis of historical linguistic data. The system allows a researcher to not only investigate previously formulated hypotheses, but also to interact with the data directly and efficiently in order to explore and identify potentially interesting correlations between linguistic features and structures contained in the data.

The text data is processed by extracting linguistic factors (i.e., data dimensions) which have been identified by the research as relevant for the task at hand, typically via the careful consultation of the existing theoretical literature. Then, the user can filter for a subset of data relevant to the analysis task. To visualize the historical developments of dimensions, the researcher has to define time periods for a diachronic comparison. The subsequent visualization of the selected dimensions over time allows the reseracher to interactively compare the distribution of all selected features and dimenstions across different time periods. Details-on-demand are moreover available on all views via mouse interaction techniques. Finally, the user can react to the insights collected from the visualization and test new hypotheses by interacting directly with the system.
So far, we’ve focused on the application of the system to Penn Treebank-style annotated corpora. However, any well-structured data set can be analyzed by means of the tool. Moreover, HistoBankVis is a browser app allowing for the upload and analysis of own data sets and supports collaborative research projects as the system stores each analysis step in a single identification URL.
In future work, we plan to add more complexity to the system in order to make significant features and interactions stand out more saliently and provide a deeper level of analysis. Furthermore, we are currently expanding the system to tasks seeking to understand linguistic variations across languages instead of across time.

