
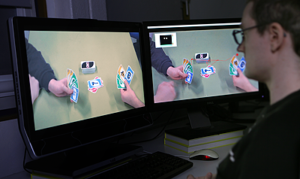
Knowing where people look at when they investigate visual stimuli such as pictures and video content provides valuable information for multiple application scenarios. Not only for marketing research, but also for many psychological and human-computer interaction studies, the investigation of viewing behavior has become a popular approach that provides a glimpse into the human mind. May it be a person sitting in front of a computer screen or walking in the park, different eye-tracking devices can record where and how long a person spent visual attention for nearly all possible visual stimuli. Depending on the device, up to 2000 gaze positions per second and the visual stimulus can be recorded for an individual person. Typically, many more persons are recorded in a user study, and the goal is to compare this massive amount of data in order to find similarities as well as outliers in the viewing behavior.
To achieve this, statistical methods are an established means to make sense out of the data. However, some aspects, especially changes in the viewing behavior and its relation to the stimulus over time, can be easier understood with visualizations. Complementary to conducting user studies in order to understand how people interpret visualizations, our second research focus lies on the development of new visualization techniques that ease the interpretation of eye-tracking data in context of the visual stimulus. Especially for video data, where the content is constantly changing, it is important to present information without the need to watch all recorded videos in order to identify interesting time spans for further investigation.
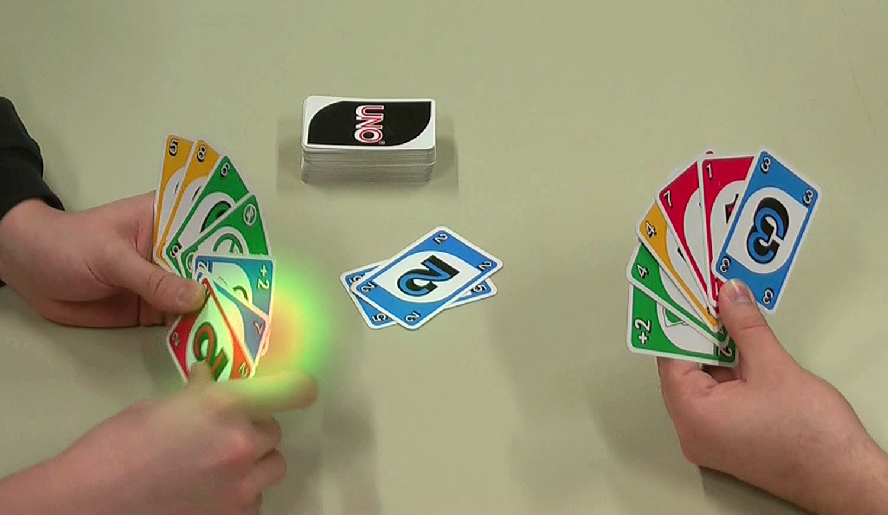
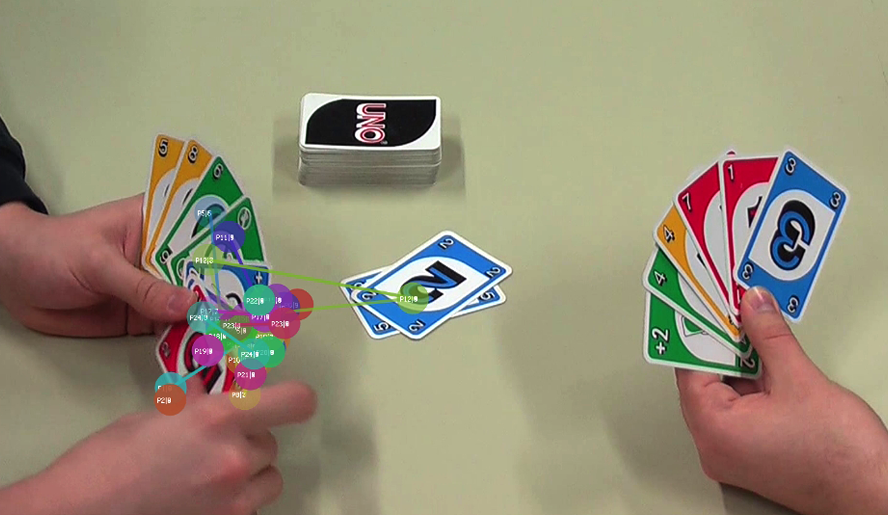
Typical visualizations are so-called attention maps and gaze plots. An attention map aggregates gaze information from one or multiple persons over time and provides an overview on the distribution of attention by visually highlighting hotspots that were investigated long and/or by many participants. To show the temporal order of how persons looked at an image, gaze plots show a sequence of fixated positions with circles and connecting lines, typically encoding the duration of the fixations by the size of the displayed circles. Both techniques can provide valuable information on static images, but for dynamic content, such as video clips, it would be necessary to display the full video with the visualization overlaid.
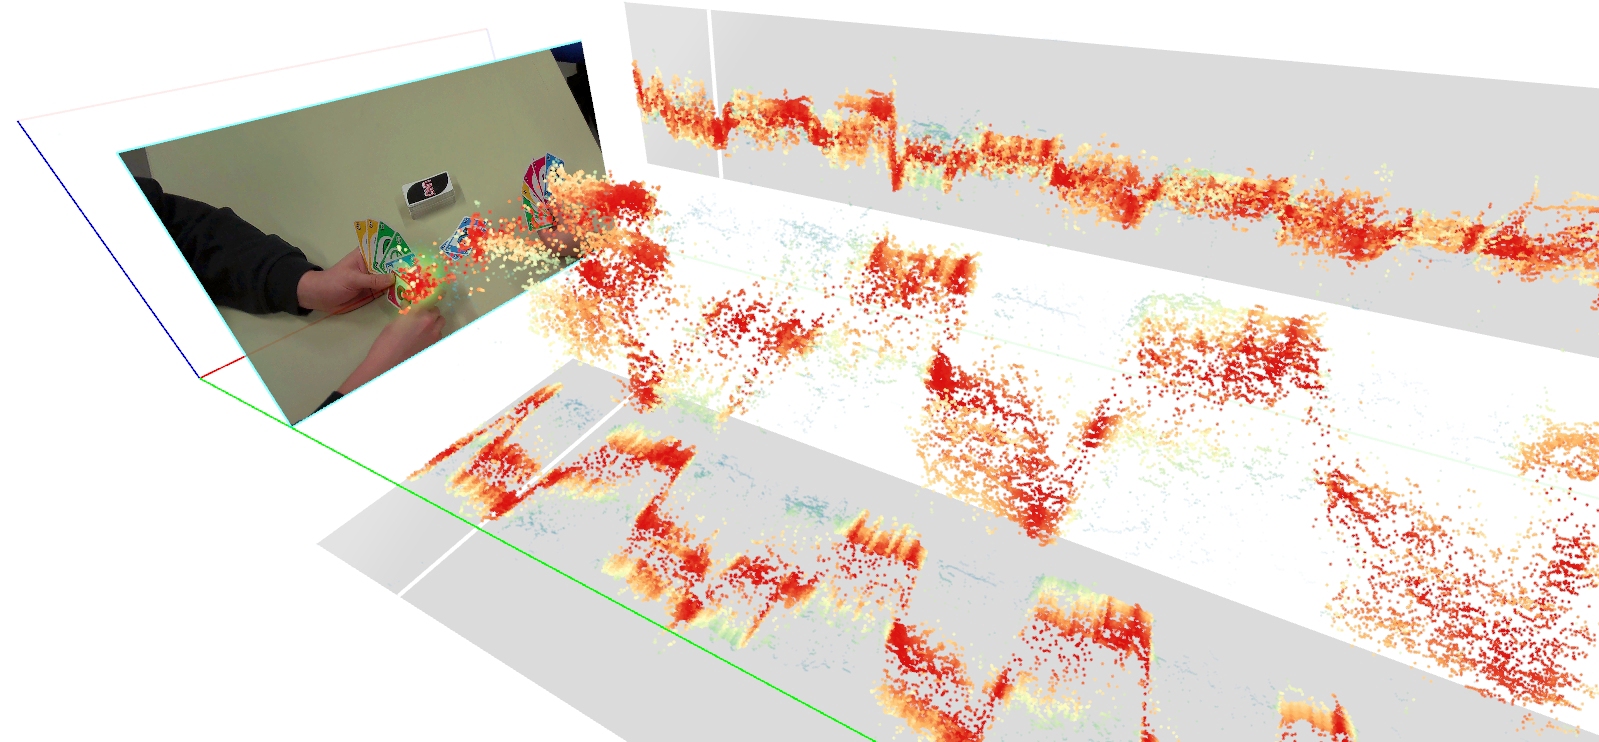
During our research, we developed new techniques that can be applied to image and video content in order to compare different persons. The first example shows a space-time cube, a visualization that shows gaze positions from multiple participants over time, with time being mapped to the third dimension. Similar to the color coding in attention maps, red areas indicate time spans where the attention of many persons was focused on specific regions, e.g., the face of a talking person in a movie. This is an important event called attentional synchrony and such time spans can be investigated to see if the attention was directed as intended, or if a distracting event occurred that was not intended by the director (e.g., reflected sun light that distracts from important content in the scene). With the space-time cube, such time spans of common viewing behavior are easy to find in a video without the need to watch the whole content. However, outliers, i.e., persons that looked differently than the majority, are not so easy to find with this technique. Furthermore, only the distribution of attention is visible in the overview; to see what happened in the video at specific points in time, one still has to jump to this position in the video.
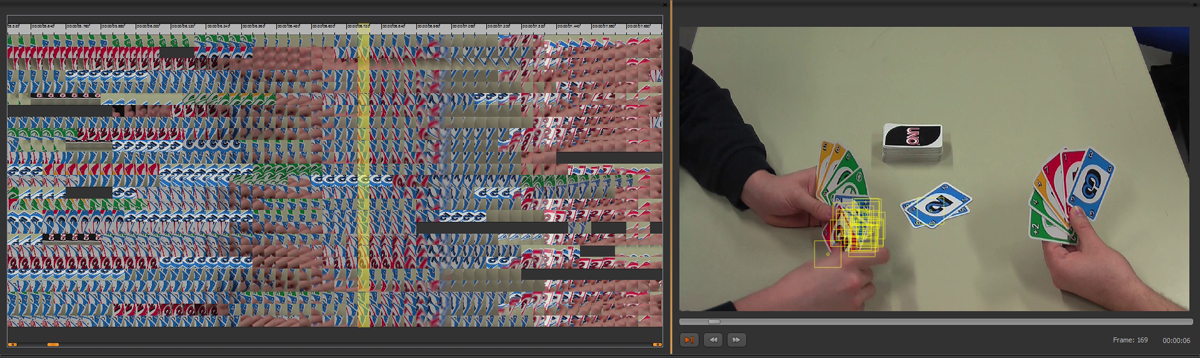
To address these problems – detecting outliers and see the video content directly – we developed the gaze stripes visualization. For each recorded person, all gaze positions are displayed by small thumbnails that show the investigated region on the stimulus. The thumbnails can be aligned on horizontal timelines to compare between persons. As a result, similar regions as well as outlier regions of investigated content become visible and the method allows an easy identification of what attracted the attention of individual persons.
In the presented examples, the content that was watched by the recorded persons was always the same, making it easier to compare between persons and relate the gaze data to one specific video. In our current research, we focus on the complex issue of mobile eye tracking data where every persons creates an individual video for which the duration and content can be very different. Comparing these datasets poses an even bigger challenge than the scenarios in our previous examples. The analysis of such data currently requires tedious manual investigation of each recorded video, which future research will aim to improve.