
Whenever we want to change things and strive for new visions, we have to understand an existing system in the first place. For that purpose scientists are working on extensive tests and studies, they take measurements and collect statistical data. The more understandable and evident their data collections are, the easier they will gain new findings and subsequently explain their results and ideas to others. With increasing complexity of the data and considering that properties and parameters may change over time, the problems become more difficult. It becomes difficult to analyze the data manually. Algorithms have to be used. Visual computing scientists continuously work on new applications and new methods for a better handling of this data using software systems. In this context visual representations are getting more and more important as they can highlight central objects, show striking relations and illustrate complex structures.
This was the topic of the doctoral thesis of Corinna Vehlow at the Visual Research Center at the University of Stuttgart. She concentrated on graph visualizations with the aim to make group structures visible.
Interactions Between Proteins
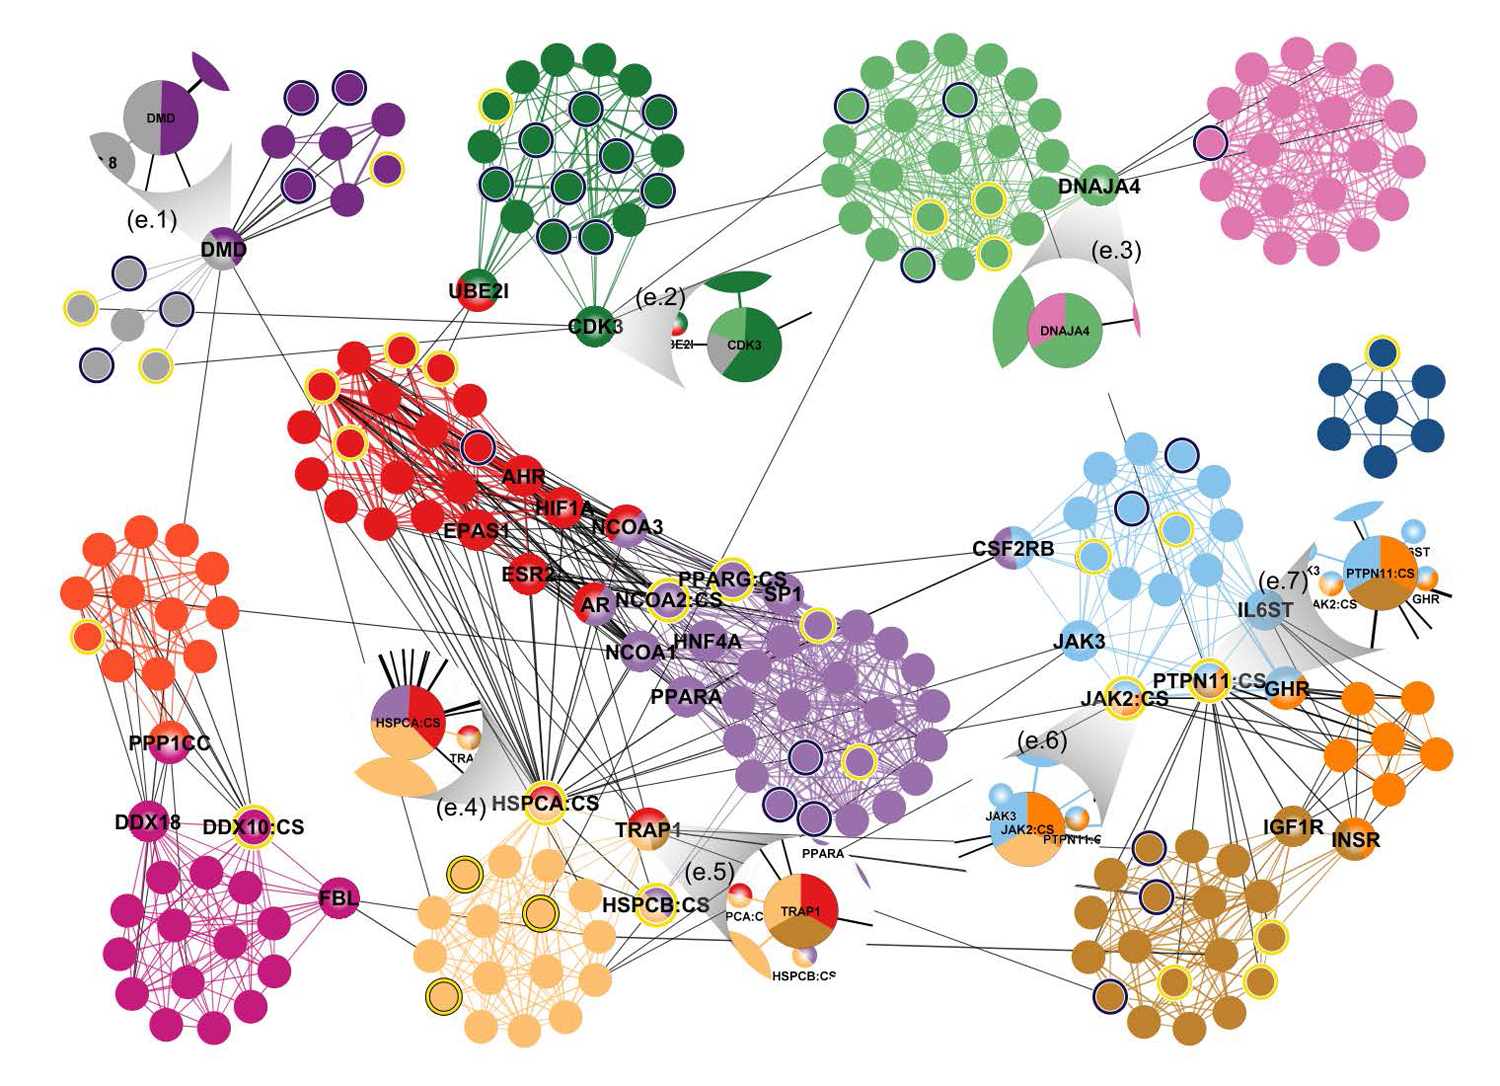
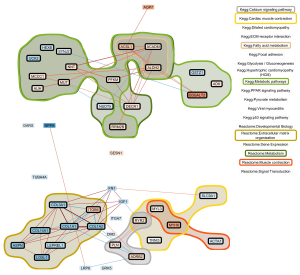
In the first instance the activities of Corinna Vehlow focused on biological questions concerning proteins. These macro molecules are not only elements of our cells but also minimal machines with specific tasks. Some proteins link special substances, others transmit electric charges or work as catalyzer for chemical reactions. When experts want to understand, which protein is responsible for a function and how the different groups of proteins interact with each other, they have to consider various complex information.
Corinna Vehlow developed new methods to visualize proteins and their association to biological functions. With such representations biologists can easily identify correlations between different proteins and understand the classification into specific groups. The images above shows about 230 proteins arranged based on their function. Focus of the circular layout of the left visualization are the interactions among particular groups.
Medical Long-Term Studies
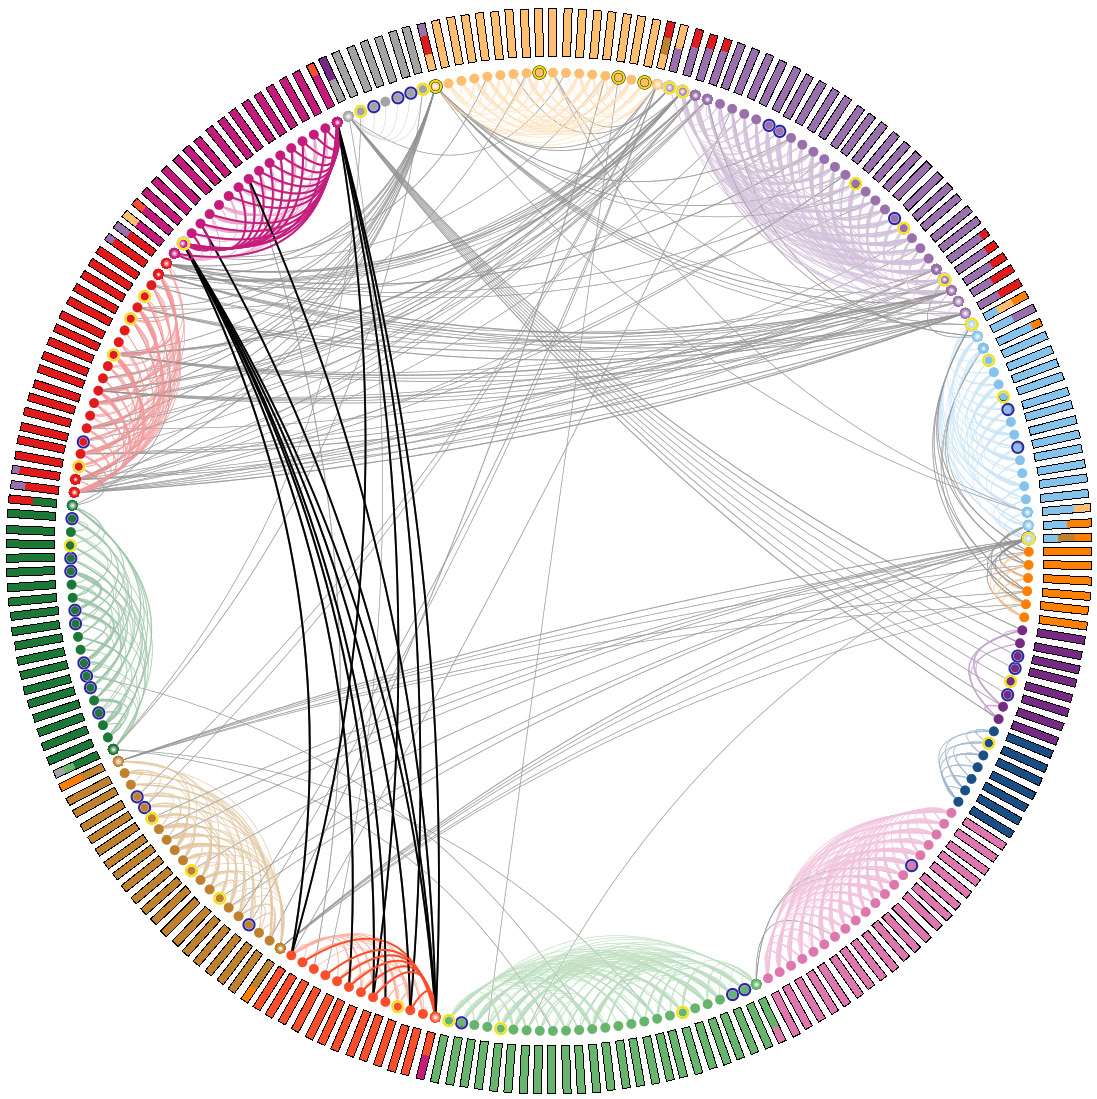
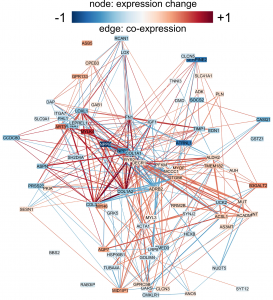
 A further visualization technique, Corinna Vehlow developed, makes the analysis of medical long-term studies easier and more efficient. This technique was developed in cooperation with the School of Medicine of the University of Colorado in Denver. The American physicians concentrated on cardiovascular diseases and wanted to know why some patients respond to a special therapy and others do not. The focus of their complex study was the correlation between the genetic predisposition of the patients and the effect of certain drugs.
The initially cluttered visualization could be viewed interactively. The physicians could filter and analyze the complex data according to their interest. This way they can test their hypotheses and find specific gene expressions that have a strong influence on the success of the examined therapy.
Social Behaviour
Also questions about the social behavior of humans can be answered easier with graphic presentations. How do people move in public buildings? When and where do they get in touch with each other? Which places are visited frequently and how do they get there? How do different groups of people interact with others? The analysis of measurements that are collected with sensors or GPS capable devices can be the basis to understand patterns of communication behavior with a relative small technical effort.
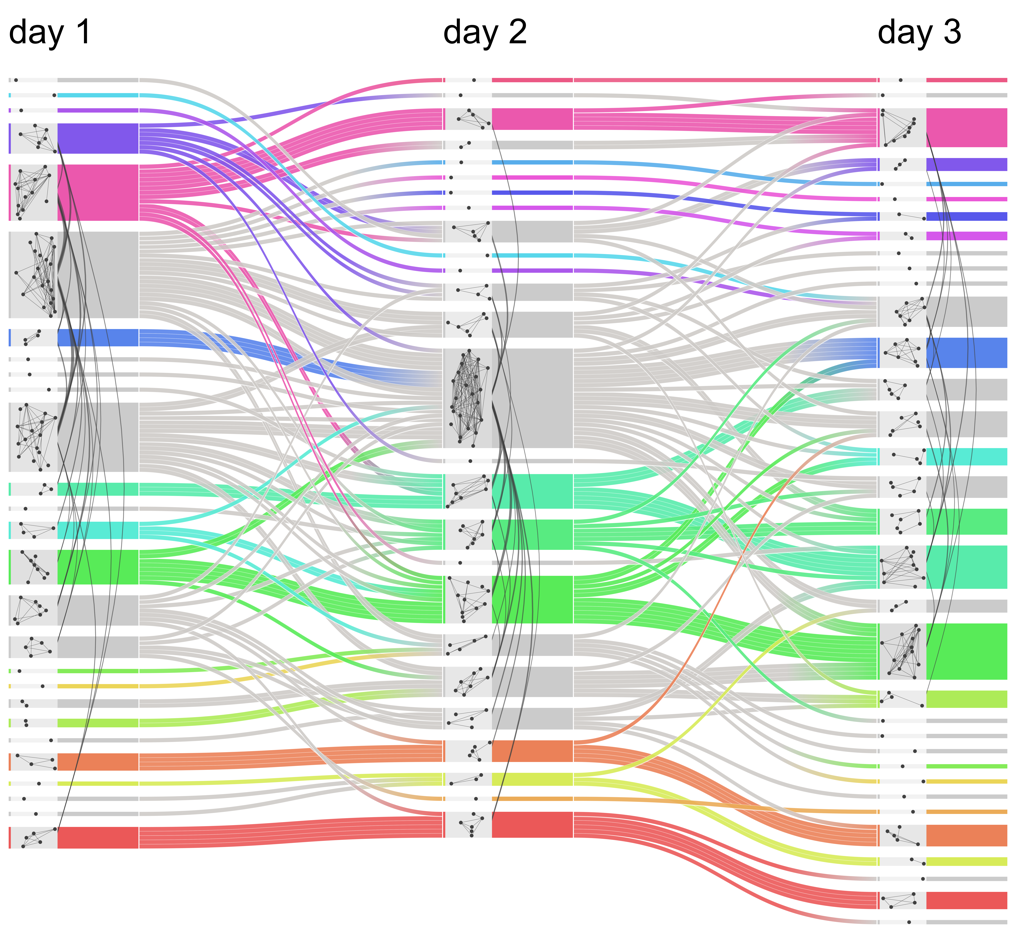 Corinna Vehlow worked with a data set that contains the distances between the single participants of a 3 days conference. The developed technique illustrates all measured contacts during the complete event. The resulting network graphic shows groups of participants that have been in contact and how long they seemed to be in a conversation. With the help of such visualizations organizers can monitor the connections among different experts. But also for social studies in wildlife or at schools such graphs can support gaining new insights.
The results and ideas of Corinna Vehlow are described in detail in her dissertation with the title “Visualization Techniques for Group Structures in Graphs”.